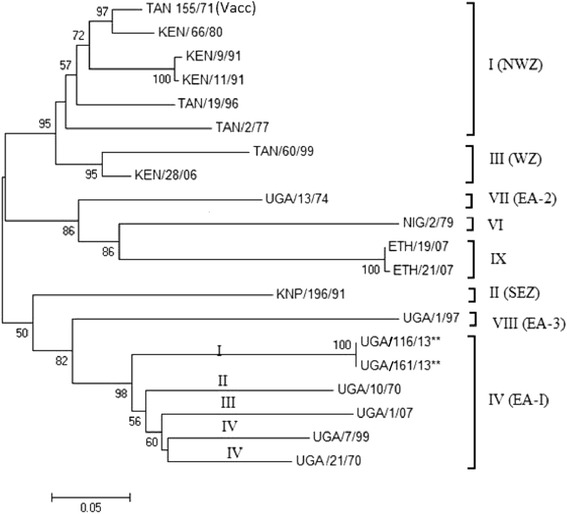
Fig. 2.

A Neighbor-joining tree showing the relationships between the VP1 coding sequences (657 nt) of the two Ugandan SAT 1 isolates from this study (UGA/116/13 [KPO25678] and 161/13 [KPO 25679] (marked **)) and SAT 1 FMDV VP1 coding sequences from Uganda (UGA), Kenya (KEN), Tanzania (TAN), Ethiopia (ETH), Nigeria (NIG) and Kruger National Park (KNP) in South Africa as obtained from GenBank (http://www.ncbi.nlm.nih.gov/genbank/). Topotypes are indicated according to Tekleghiorghis et al. (2014) [49]. Bootstrap values are indicated. Scale bar indicates nucleotide substitutions per site
