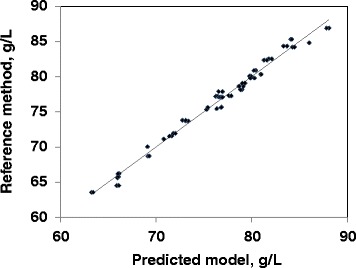
Fig. 2.

Linear regression plots for total protein. Relationship between total protein concentration (g L−1) measured by the reference method and by FT-MIR spectrometry in plasma using mid-infrared spectra (70 observations). (R2 = 0.985; root mean square error of cross validation = 0.7452; RER = 31.3; RER is the range error ratio, and is obtained dividing the range of total protein by its standard deviation of prediction errors; RPD = 8.4; RPD is the ratio of prediction to deviation, and is obtained dividing the standard deviation of total protein by its standard deviation of prediction errors)
