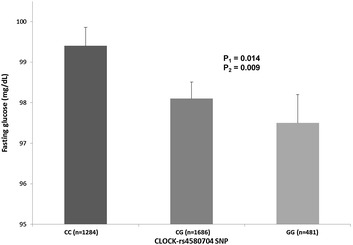
Fig. 1.

Association between the CLOCK-rs4580704 SNP and fasting glucose in non-T2D subjects at baseline. Means values and SE of means (error bars) are represented depending on the CLOCK genotypes. The P-values for the polymorphism were obtained in the dominant model for G-carriers vs CC subjects. P 1 Unadjusted model. P 2 Model adjusted for sex, age, field center and BMI
