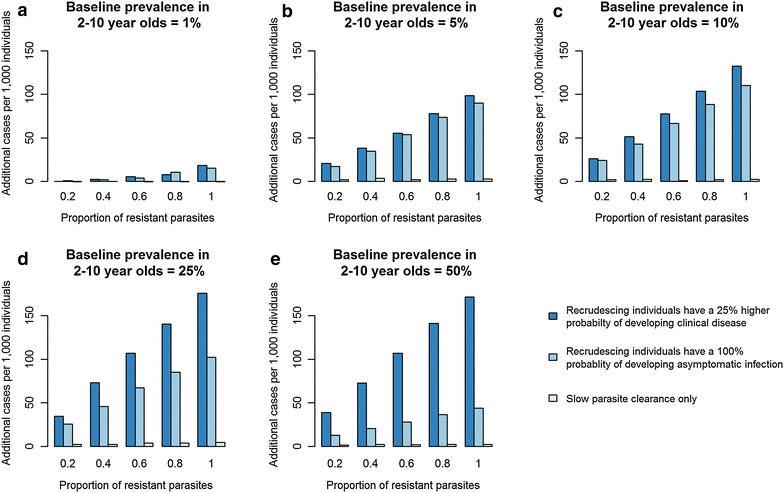
Fig. 2.

Impact of three treatment outcomes of ACT resistance on clinical incidence (mean number of cases of malaria per 1000 individuals per year) in five different transmission settings (baseline parasite prevalence in 2–10 year olds = 1, 5, 10, 25 and 50 %). The dark blue bars (LCF) show the situation where recrudescing individuals have a 25 % greater probability of developing clinical infection after recrudescing compared to after a new infection. The medium blue bars (LPF) show the situation where all recrudescing individuals develop late parasitological failure (asymptomatic patent infection). The light blue bars show the situation where individuals clear parasites slowly after treatment but do not go on to recrudesce. The proportion of infections recrudescing or with slow parasite clearance is shown on the x-axis
