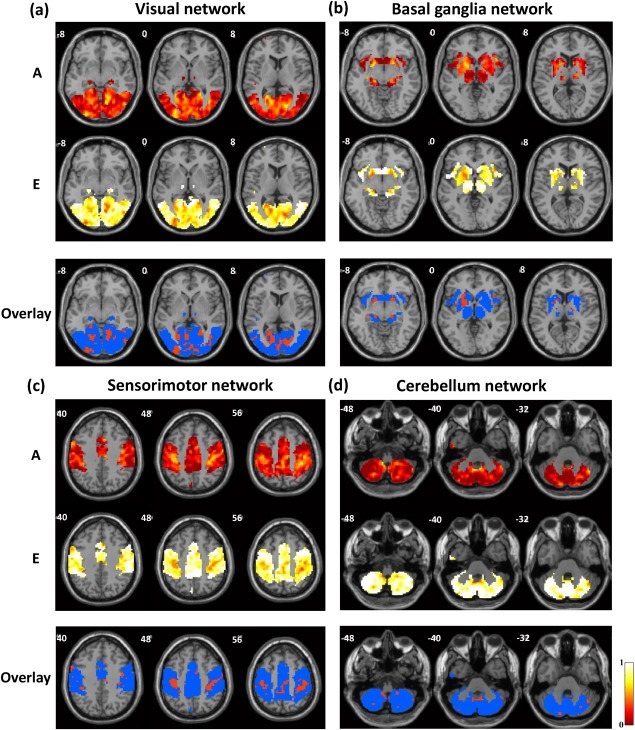
Figure 2.

Genetic and environmental influences on the (a) visual network, (b) basal ganglia network, (c) sensorimotor network, and (d) cerebellum network. First two rows: the additive genetic (A, first row) and unique environmental (E, second row) maps. Third row: thresholded A map (A > 0.4, red) overlaid on the corresponding E map (blue).
