Fig. 2.

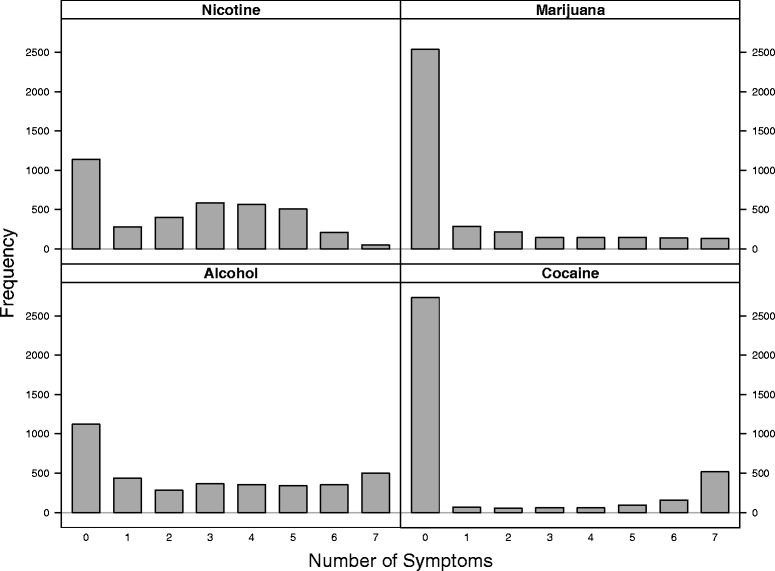
The distributions of phenotypes for alcohol, nicotine, marijuana and cocaine dependence. The x-axis is the number of symptoms, and the y-axis is the frequency

The distributions of phenotypes for alcohol, nicotine, marijuana and cocaine dependence. The x-axis is the number of symptoms, and the y-axis is the frequency