
Figure 3.
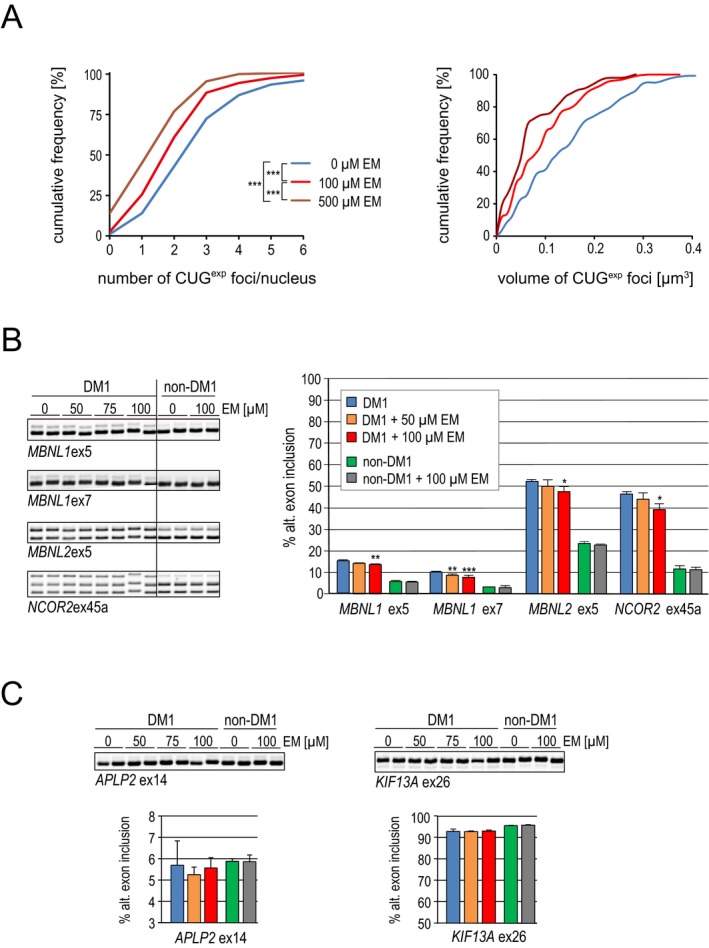
Erythromycin diminishes CUG exp foci size and corrects splicing defects in DM1 cells. (A) Left: Graph showing the distribution of nuclei containing different number of CUG exp foci. The number of cells counted was 200 for both untreated and erythromycin (100‐ or 500‐μmol/L) treated fibroblasts. Right: The distribution of CUG exp foci volume (μm3). The number of foci measured for volume was 120 for both untreated and erythromycin treated fibroblasts. P‐value was determined using the Mann–Whitney U test; ***P < 0.001. (B) Analysis of alternative splicing of MBNL1 ex 5, MBNL1 ex7, MBNL2 ex5, and NCOR2 ex45 by RT‐PCR in DM1 and non‐DM1 fibroblasts after incubation for 2 days with 50‐ or 100‐μmol/L erythromycin. *P < 0.05. **P < 0.01. Error bars indicate SDM. (C) As in (B), but shows the analysis of alternative splicing of two MBNL‐independent exons, APLP2 ex14 and KIF13A ex26. DM1, myotonic dystrophy type 1; RT‐PCR, reverse transcription polymerase chain reaction; MBNL, muscleblind‐like.