
Figure EV1. Schematic of the approach used to generate the High‐confidence (Hc) network.
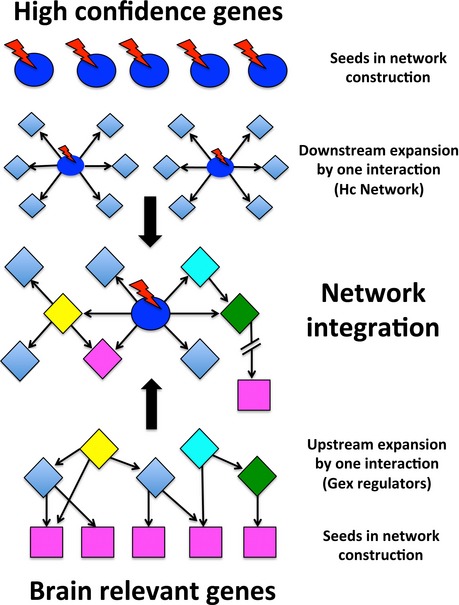
Thirty‐two (32) Hc genes (blue circles) were mapped onto Metacore GeneGo to construct a Hc network. Each Hc gene was used as node to identify direct downstream targets (diamond shapes). Red lightning bolts represent the possible presence of mutations affecting the Hc genes. Similarly, twenty‐three (23) brain‐relevant genes (purple squares) were used in Metacore to look for direct upstream regulatory genes (yellow, cyan, green diamond shapes). Downstream and upstream targets were integrated into a final Hc network.