
Figure 1. Chromatin contact maps (Hi‐C) and matched gene expression (CAGE) data in murine neuronal differentiation system.
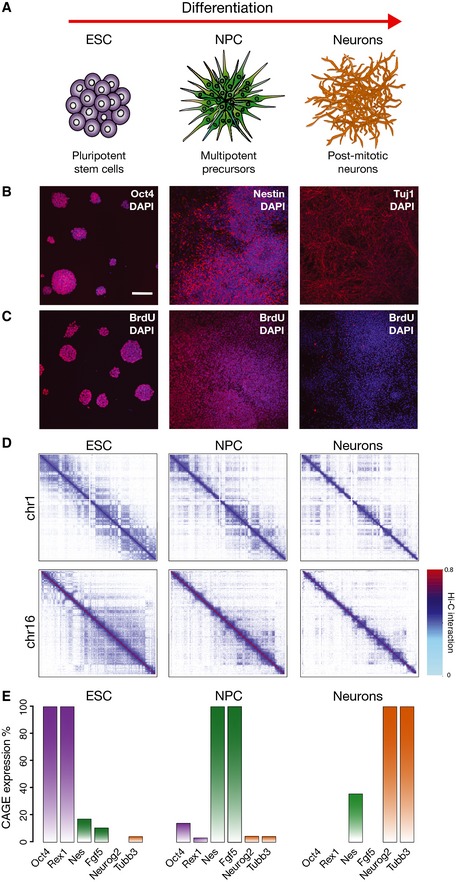
- Scheme of the murine differentiation system of our study, from ESC to NPC and post‐mitotic neurons.
- Cells express stage‐specific markers as detected by immunofluorescence: ESC express Oct4, NPC the neuronal precursor marker nestin and Neurons Tubb3 (Tuj1 antibody). Scale bar, 100 μm.
- ESC and NPC are actively cycling, whereas Neurons are negative for BrDNA after 24‐h BrdU incorporation. Nuclei were counterstained with DAPI.
- Examples of interaction patterns in Hi‐C matrices across the whole chromosomes show extensive higher‐order dynamic contacts, which change during terminal neuronal differentiation. Hi‐C interaction data are plotted in log scale.
- Matched CAGE data sets were produced from total RNA extracted from ESC, NPC and Neurons. The expression levels confirm specific expression of stage‐specific markers. CAGE expression reported as a percentage relative to highest expression.