
Figure 3. metaTAD tree organization correlates with genomic, epigenomic and expression features.
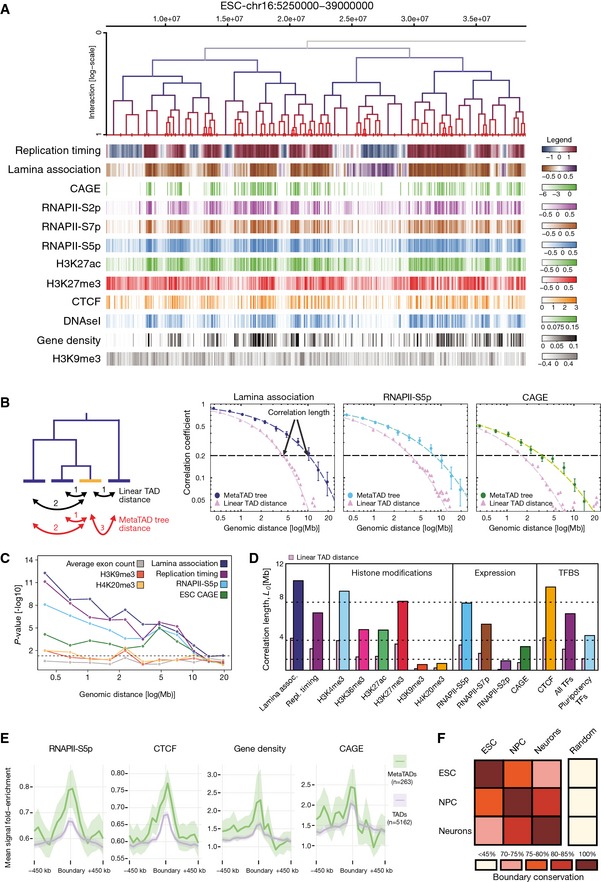
- Comparison between the distribution of epigenomic, genomic and gene expression features with the metaTAD tree structure.
- Left side: the diagram represents the difference between linear and metaTAD tree distance (number of edges along the tree minus one) for a given TAD (yellow) relative to other TADs (blue) in the same tree. Right side: correlations over the tree extend up to genomic scales of tens of Mb (filled circles) and are significantly stronger than those observed in linear genomic sequence (filled triangles). The horizontal dashed line indicates a 20% correlation coefficient.
- Statistically significant differences are observed in the correlations measured across the metaTAD tree and across random neighbour trees constructed from the same linear array of TADs (horizontal line P‐value = 0.05). Heterochromatin marks H4K20me3 and H3K9me3 levels do not correlate with the tree structure above what is expected from linear genomic distance.
- CAGE data, different epigenomic features and pluripotency transcription factors binding sites (TFBS) have different average correlation lengths.
- Genome‐wide profiles averaged over all TAD or metaTAD boundaries of selected epigenomic features and gene densities (ribbons show 95% confidence intervals of the mean; metaTADs considered had length 10–40 Mb). Higher feature enrichments are observed at metaTAD boundaries (green) than TAD boundaries (violet).
- Approximately two‐thirds of TAD boundaries are conserved from ESC to Neurons.