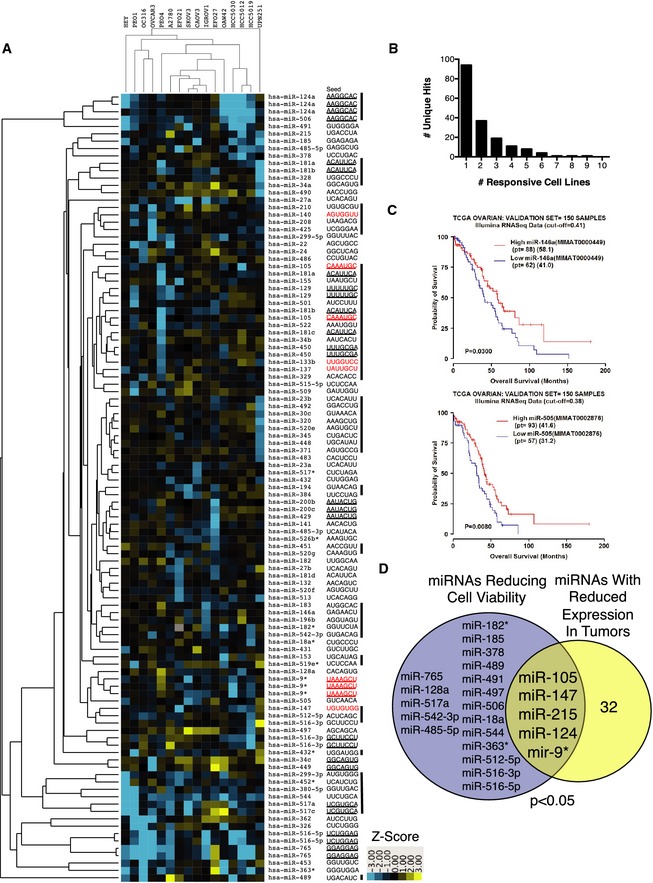
Figure 1. Public and private miRNA vulnerabilities among ovarian cancer cell lines.

- Two‐way unsupervised hierarchical cluster of z‐score distributions by Euclidian distance. Any miRNA mimic with a z‐score ≤ −2 in at least one cell line was included. Seed sequences of each miRNA mimic are on the right. Bars correspond to arbitrary cluster boundaries. Seeds in red correspond to miRNAs with decreased expression in serous, clear cell, or endometrioid ovarian cancer relative to normal tissue (Iorio et al, 2007).
- The histogram indicates the number of non‐redundant hits binned according to the number of responsive cell lines.
- Expression of miRNAs miR‐146a and miR‐505 correlated with overall survival in ovarian cancer patients. The validation cohort (n = 150 samples) is shown. See Fig EV1 for the training cohort.
- Intersection of miRNA sensitivities in the non‐clonal short‐term cultures and miRNAs with reduced expression in serous ovarian cancer (Iorio et al, 2007). P‐value from hypergeometric distribution.
