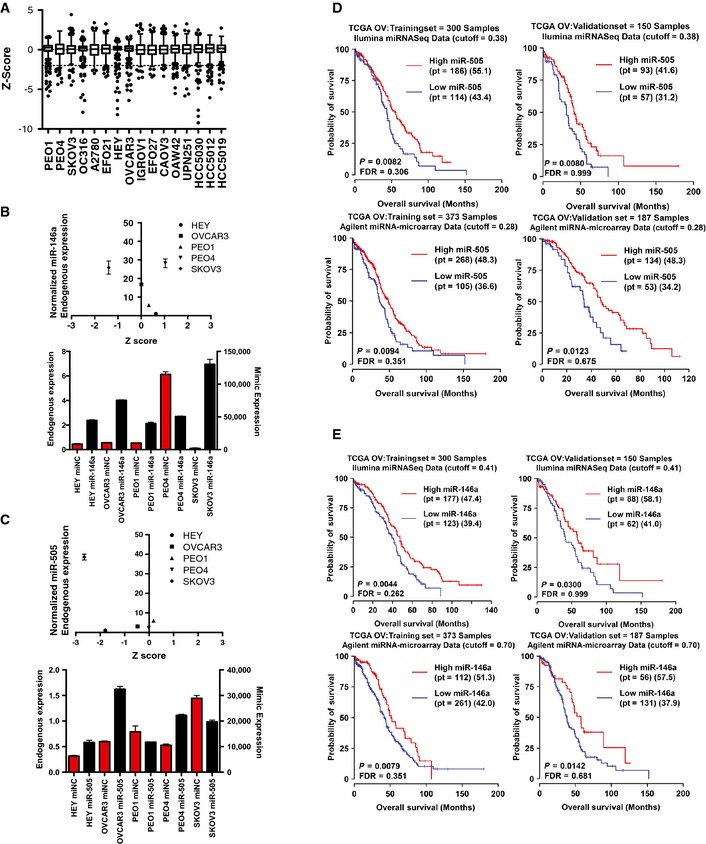
Figure EV2. Increased expression of miR‐146a and miR‐505 correlates with increased patient survival.

- A Tukey plot of the range of z‐scores for all mimics screened in each cell line screened. Z‐scores are representative of the mean viability of 3 replicates.
- Quantitative PCR (qPCR) analysis of endogenous miR‐146a expression revealed no association between level of expression in a cell line and toxicity in the screen (top panel). To facilitate line‐to‐line comparison, endogenous expression values were normalized to a reference cell line (Hey cells). qPCR showed similar levels of overexpression among all cell lines (bottom panel). Bars in red display the endogenous expression of miR‐146a (normalized to RNU6B using the comparative CT method), while bars in black display the overexpression of miR‐146a mimic after transfection (normalized similar to endogenous expression).
- qPCR analysis of endogenous miR‐505 expression revealed no association between level of expression in a cell line and toxicity in the screen (top panel). To facilitate line‐to‐line comparison, endogenous expression values were normalized to a reference cell line (Hey cells). qPCR showed similar levels of overexpression among all cell lines (bottom panel). Endogenous and overexpression values displayed as in (B). Bars represent the mean of 2 replicates ± SD.
- Kaplan–Meier plots of training and validation sets of tumors using miRNA expression from both Agilent arrays and Illumina miRseq showed that higher expression of miR‐505 correlated with increased patient survival.
- Kaplan–Meier plots of training and validation sets of tumors using miRNA expression from both Agilent arrays and Illumina miRseq showed that higher expression of miR‐146a correlated with increased patient survival.
