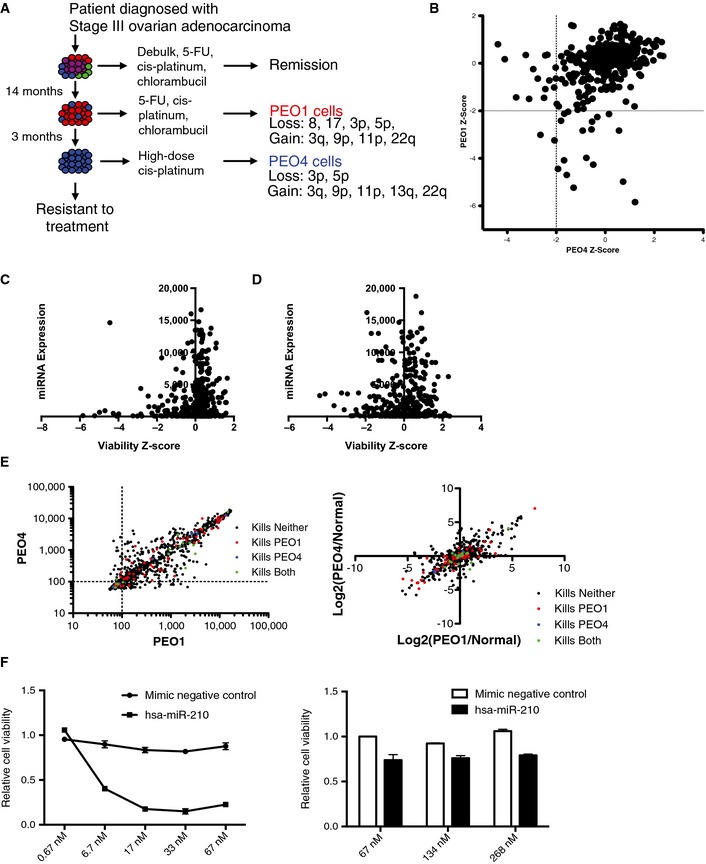
Figure EV3. Distinct miRNA sensitivities in patient‐matched cell lines from recurrent disease.

- A schematic depicting the derivation of the PEO1 and PEO4 cell lines from a patient with high‐grade serous adenocarcinoma of the ovary.
- A scatter plot of z‐scores corresponding to inhibition of viability in PEO1 versus PEO4 in response to each of 400 miRNA mimics. Values were derived from the mean of triplicate experiments. Mimics with a z‐score < 2 were considered to have significantly reduced viability in a cell line. 17 mimics reduced PEO1 cell viability, 15 mimics reduced PEO4 viability, and 2 mimics reduced viability in both cell lines.
- The scatter plot indicates the expression value of each miRNA in PEO1 (y‐axis) and the effect of each miRNA on cell viability in the same cell line as represented by z‐score (x‐axis).
- The scatter plot indicates the expression value of each miRNA in PEO4 (y‐axis) and the effect of each miRNA on cell viability in the same cell line as represented by z‐score (x‐axis).
- The scatter plots indicate the expression values of each miRNA in PEO1 (x‐axis) and PEO4 (y‐axis) (left panel), and miRNA expression relative to that in HOSE (Normal) cells (right panel). Points are color‐coded according to the corresponding miRNA mimic activity in the viability screens.
- PEO1‐specific hit miR‐210 continues to show a robust phenotype at even a 10‐fold dilution while increasing the dosage 4‐fold does not sensitize PEO4 cells, suggesting that selectivity was not due to overt dosage effects. Each data point represents the mean of 3 independent experiments ± SD.
Source data are available online for this figure.
