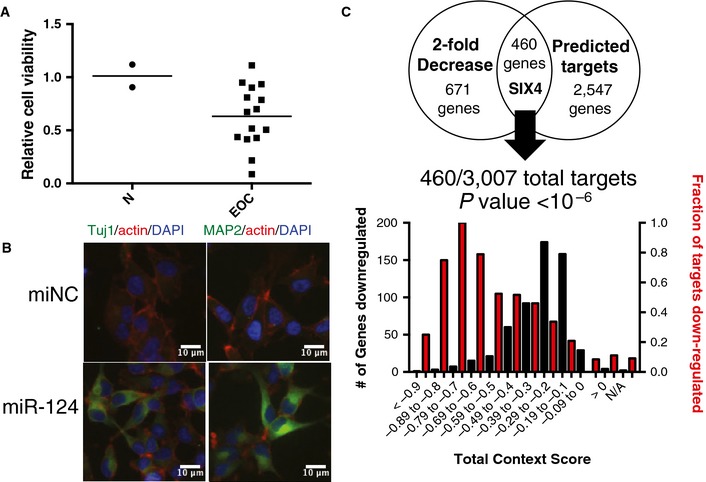
Figure 4. miR‐124‐induced reprograming of EOC gene expression profiles.

- Consequence of miR‐124 on EOC cell viability (as in Fig 2A). N, normal cell lines (IHH and HOSE). In the screen, miR‐124 was found to significantly reduce cell viability (z ‐score < −2) in 6 cell lines, and TCGA expression data revealed no significant change in expression of this miRNA in ovarian tumors.
- miR‐124 induced expression of neuronal marker proteins Tuj1 (TUBB3) and MAP2 in ES2 cells 48 h post‐transfection. Cells were counterstained with DAPI and phalloidin.
- miR‐124‐responsive genes in PEO1 cells were enriched for TargetScan predicted targets. P‐value from hypergeometric distribution.
Source data are available online for this figure.
