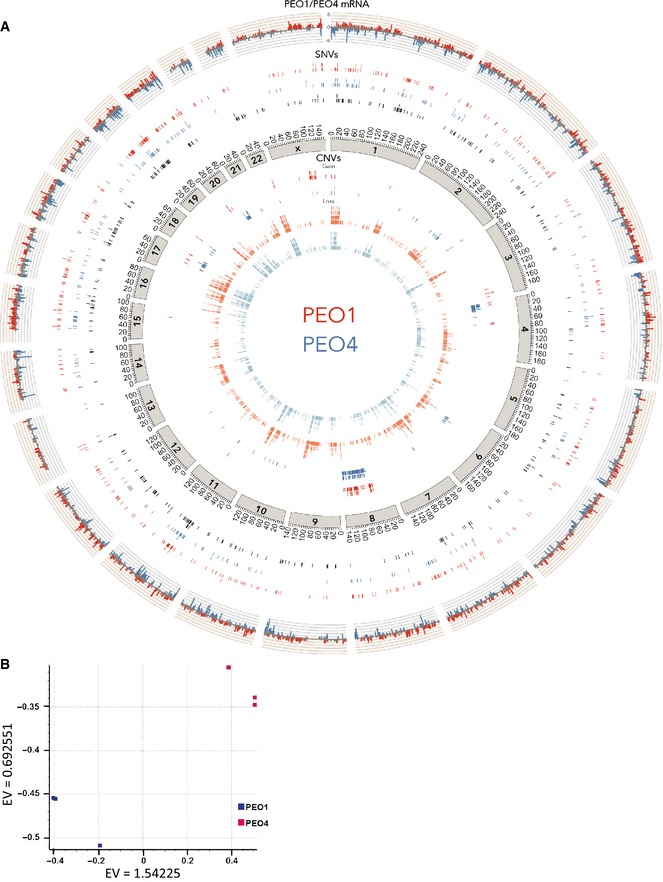
A summary of the PEO1 and PEO4 genomic characterization is displayed by circos plot. The outer track indicates relative expression of genes (the log
2 of the ratio of (RPKM+1) values of PEO1 versus PEO4). Red peaks correspond to genes with greater than two‐fold overexpression in PEO1 cells, and blue peaks correspond to genes with greater than two‐fold overexpression in PEO4 cells. The next three tracks represent SNVs unique to PEO1 in red, unique to PEO4 in blue, and common in black. This is followed by an axis indicating chromosome position. The inner four tracks summarize CNV as indicated (variation is defined by a read depth ratio of ≥ 1.5 (gain) or ≤ 0.5 (loss) as compared to the reference cell line). See
Datasets EV2,
EV3, and
EV4 for detailed annotations.