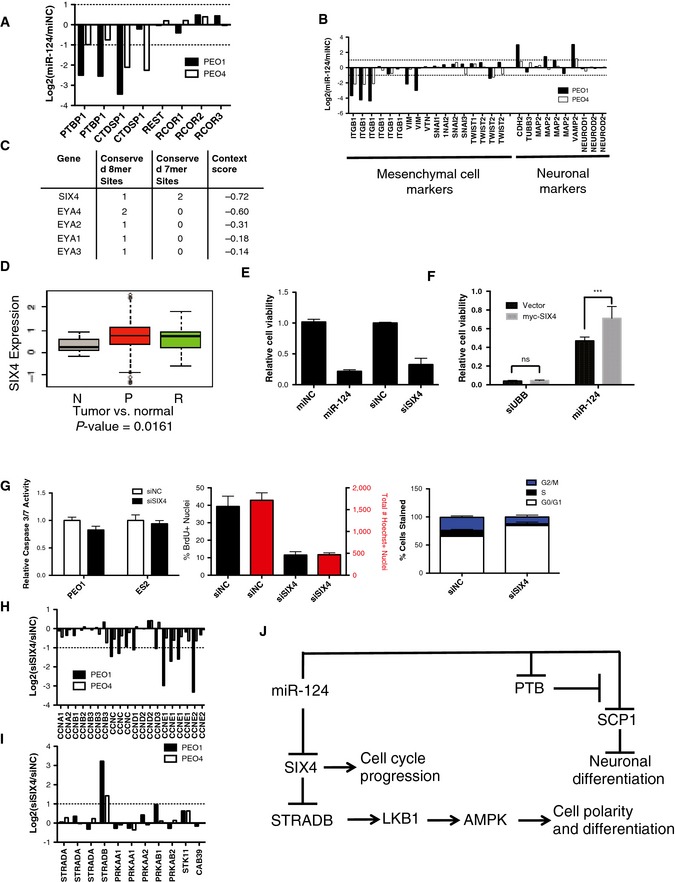
Figure EV7. Identification of miR‐124‐responsive genes.

- Expression of miR‐124 mimic reduced expression of PTBP1 (PTB) and CTDSP1 (SCP1) but not other members of the REST complex on a microarray. Each bar represents the log2 of the ratio of the means of three experiments of mir‐124 mimic expression to mimic negative control expression of a single probe on the microarray.
- miR‐124 mimic expression reduced expression of mesenchymal markers ITGB1, VIM, and TWIST2 and increased expression of neuronal markers CDH2, VAMP2, and MAP2 according to the microarray data. Each bar represents the log2 of the ratio of the means of three experiments of mir‐124 mimic expression to mimic negative control expression of a single probe on the microarray.
- SIX4, EYA1, EYA2, EYA3, and EYA4 are predicted targets of miR‐124 in TargetScan (www.targetscan.org).
- SIX4 expression is significantly enriched in human ovarian tumors relative to normal ovarian tissue. P‐value from Welch two‐sample t‐test. N, unmatched normal ovarian tissue; P, primary epithelial ovarian tumors; R, recurrent epithelial ovarian tumors.
- Knockdown of SIX4 reduced cell viability similar to expression of a miR‐124 mimic in PEO1 cells (mean ± SD of 3 experiments).
- Expression of a SIX4 construct that cannot be targeted by miR‐124 partially rescues toxicity due to miR‐124 over expression in PEO1 cells. Mean ± SD of 6 experiments. Two‐way ANOVA analysis, ***P < 0.005.
- SIX4 knockdown did not induce activation of caspase‐3 and caspase‐7. Depletion of SIX4 reduced BrdU incorporation in ES2 cells and resulted in decreased Hoechst‐positive nuclei 48 h post‐transfection. SIX4 knockdown also resulted in decreased cells in S‐phase as seen in PI‐stained ES2 cells 48 h post‐transfection. All bars represent the mean ± SD of three experiments.
- Knockdown of SIX4 reduced expression of multiple cyclin proteins in PEO1 and PEO4 cells on the microarray. Each bar represents the log2 of the ratio of the means of three experiments of SIX4 siRNA transfection to siRNA negative control transfection of a single probe on the microarray.
- SIX4 knockdown induced expression of STRADB in PEO1 and PEO4 cells according to the microarray data. Each bar represents the log2 of the ratio of the means of three experiments of SIX4 siRNA transfection to siRNA negative control transfection of a single probe on the microarray.
- Schematic of predicted interactions of miR‐124 with cell cycle and cell differentiation machinery.
Source data are available online for this figure
