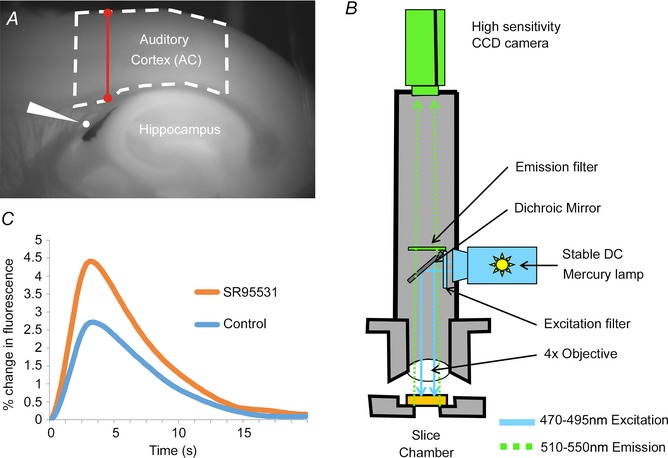
Figure 1. Experimental set‐up .

A, raw FAD+ of a brain slice as it sits in the chamber, illustrating the position of the AC, the stimulating electrode (white wedge) and the hippocampus. Dashed line represents the ROI analysed. Red barbell represents the location where cortical thickness was measured. B, schematic diagram of the imaging rig, illustrating the wavelengths for excitation and emission, positions of the light source and camera, as well as the associated optics. C, time course of FAD+ signal, both under control conditions and in the presence of SR95531, illustrating the relatively slow rise and fall of the FAD+ signal.
