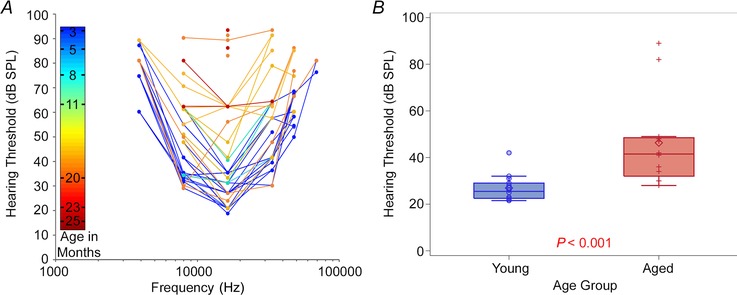
Figure 2. Hearing thresholds .

A, changes in hearing threshold, as measured using ABRs in response pure tones at frequencies of 4–64 kHz, as a function of age. The colour bar corresponds to age of animal in months. B, mean hearing threshold, measured using ABRs in response to broadband noise, in young versus aged animals.
