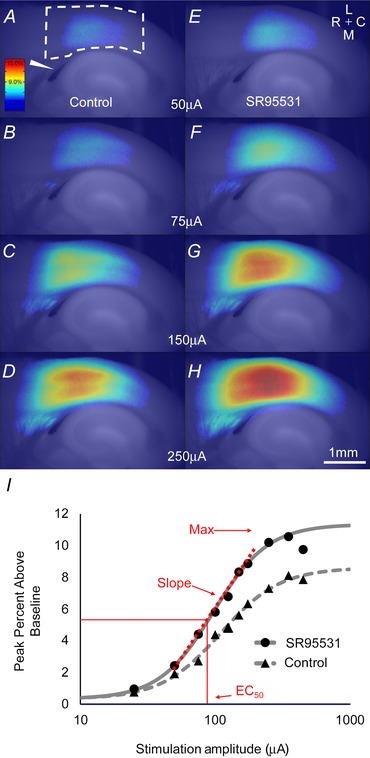
Figure 3. .

A, activation in the AC of a young animal in response to electrical stimulation of white matter at 50 μA. The colour bar shows colours corresponding to the maximum percentage above baseline generated by the flavoprotein signal. The wedge indicates the stimulating electrode location. Dashed line represents the AC ROI. Scale bar in H is 1 mm. B–D, progressively increasing amplitudes of stimulation in control ACSF. E, activation in SR95531 conditions to 50 μA. The compass rose indicates: medial (M), lateral (L), rostral (R) and caudal (C). F–H, progressively increasing amplitudes of stimulation in SR95531 ACSF. I, sigmoid curves fit to all data points from this animal in both the control ACSF condition and SR95531 condition. Red lettering and arrows show the locations for maximum and EC50 for the SR95531 curve, as well as the portion of the curve where the slope was derived. Activation shown here is relatively high, but representative of the data seen in this study.
