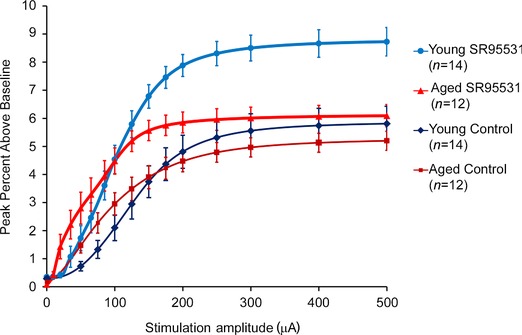
Figure 4. Averaged input–output curves from young and aged animals in control and SR95531 conditions .

Values are displayed as mean and SEM at standard stimulation amplitudes. Data to compute the means are derived from the fitted sigmoidal input–output curves.
