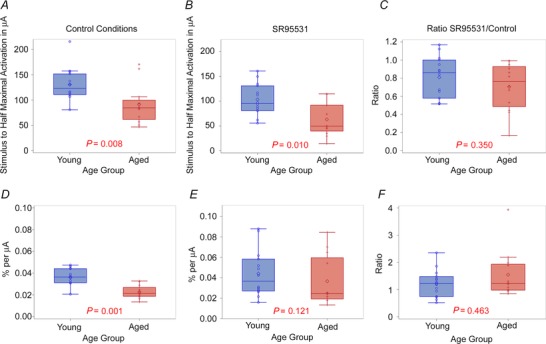
Figure 6. EC50 and slope of the input–output functions for young and aged animals .

A and B, pairwise comparisons of the EC50 for young and aged animals under control conditions (A) and in the presence of SR95531 (B). C, pairwise comparison of the ratio of the EC50 under SR95531 conditions to control conditions in young versus aged animals. D and E, pairwise comparisons of the slope of the input–output functions for young and aged animals under control conditions (D) and in the presence of SR95531. F, pairwise comparison of the ratio of the slope under SR95531 conditions to control conditions in young versus aged animals.
