
Figure 9. Redox ratio in the slice as perturbed by three increasing concentrations of H2O2 and two concentrations of NaCN .
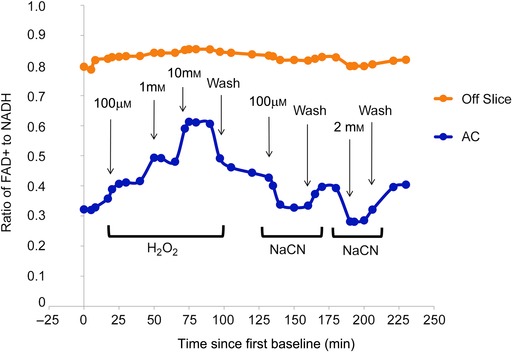
Three measurements established a baseline and washouts were performed after the highest concentration of H2O2, between the two concentrations of NaCN and at the end of the experiment to determine the new baseline.