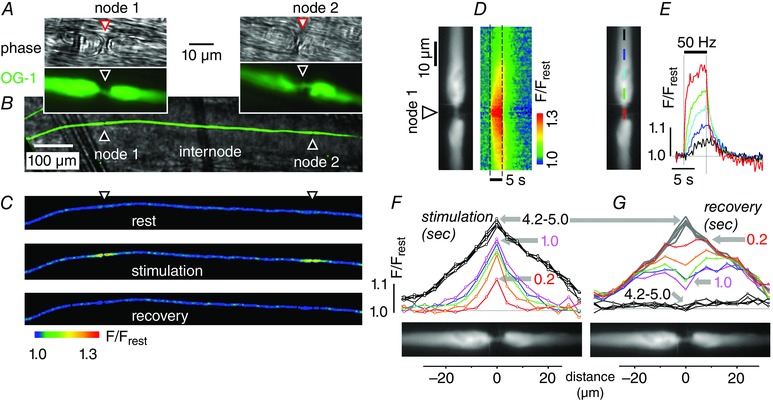
Figure 1. Stimulation‐induced elevations of [Ca2+] originate at nodes of Ranvier .

All records are from the phrenic nerve axon illustrated in A–C, which was iontophoretically injected with the Ca2+ indicator OG‐1 and stimulated at 50 Hz for 5 s. The low magnification field in Fig. 1 B shows a fluorescence image of the injected axon (green) superimposed on a phase image (grey) of the phrenic nerve trunk. C shows 3 fluorescence micrographs (coded as F/F rest) of this axon before, during and after stimulation. In the pseudocoloured images of C and D, blue indicates low resting [Ca2+] and warmer colours indicate elevated [Ca2+]. The stimulated image in C shows two areas of elevated [Ca2+], both of which were identified as nodes in the phase (greyscale) and fluorescence (green) images shown in A and B. Distance calibration bar in B also applies to C. Records in D–G came from node no. 1; each plot is shown adjacent to a greyscale fluorescence image defining nodal and paranodal regions. D, pseudocoloured image shows the time course of [Ca2+] changes (measured as F/F rest) before, during and after the stimulus train (duration indicated by dashed lines) along the length of the axon (vertical axis indicates location, horizontal axis indicates time). E, superimposed time courses of stimulation‐induced F/F rest changes at different distances from the node. Coloured bars in the fluorescence image indicate the location at which each F/F rest trace was measured. F and G, spatial plots of F/F rest for the indicated times (0.2–5 s) after the onset (F) and termination (G) of stimulation. Recovery curves in G began at the peak of the stimulation response shown in F.
