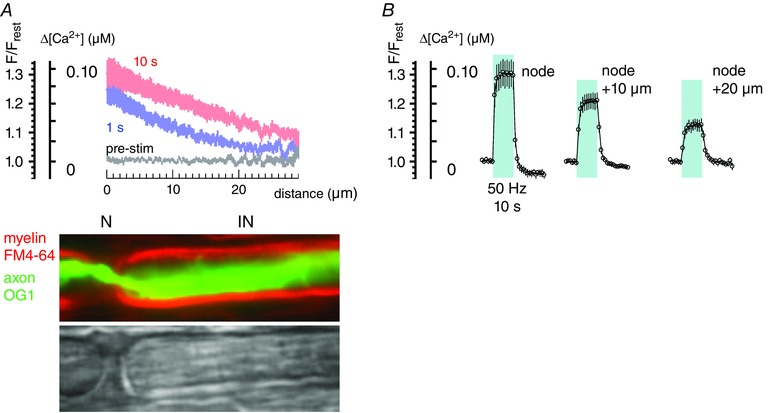
Figure 2. Responses to stimulation averaged for 11 phrenic nerve axons .

A, average change in F/F rest and Δ[Ca2+] as a function of distance, calculated for the 1st and 10th second of stimulation trains at 50 Hz. Phase (greyscale) and coloured fluorescence images indicate the nodal (N) and internodal (IN) locations corresponding to the plotted distances. B, averaged time course of changes in F/F rest and Δ[Ca2+] for nodes and locations 10 and 20 μm distant from nodes. Shading indicates duration of stimulation. Bars indicate ± SEM. Equations used to convert F/F rest measurements into estimates of Δ[Ca2+] are given in Methods.
