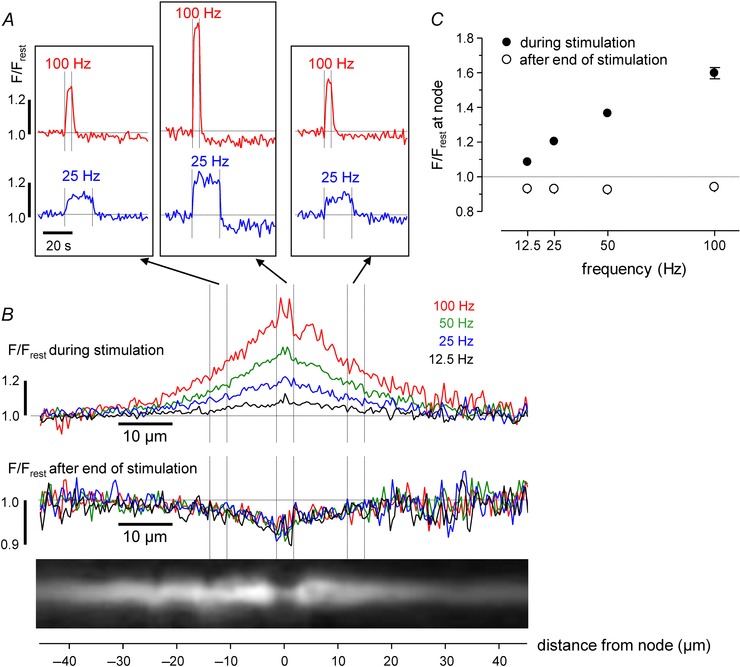
Figure 3. Frequency dependence of responses before and after stimulation in a phrenic axon .

Each stimulus train consisted of 500 stimuli administered at the indicated frequency (12.5 Hz for 40 s, 25 Hz for 20 s, 50 Hz for 10 s and 100 Hz for 5 s). A, time course of F/F rest changes for 100 Hz and 25 Hz stimulation measured at the node and flanking regions of the axon illustrated in the fluorescence image in B. B, superimposed spatial profiles of F/F rest changes measured during (upper) and after (lower) stimulation at the indicated frequencies. Traces in A and B are averages of 3–4 repetitions at each frequency (repeated cycles of 12.5, 25, 50, 100 Hz). C, mean (± SEM) change in nodal F/F rest during (filled circles) and after (open circles) stimulation at the indicated frequencies (SEM was usually smaller than point diameter). In B, each trace labelled ‘during stimulation’ was generated by averaging spatial profiles (acquired each second) at times when nodal F/F rest stabilized at a plateau level. These times are the last 38 s of the 12.5 Hz train; last 18 s of 25 Hz train; last 8 s of 50 Hz train; last 3 s of 100 Hz train. Each trace labelled ‘after end of stimulation’ was generated by averaging spatial profiles over a period during which nodal F/F rest was relatively stable, 5–20 s after the end of stimulation, for all trains.
