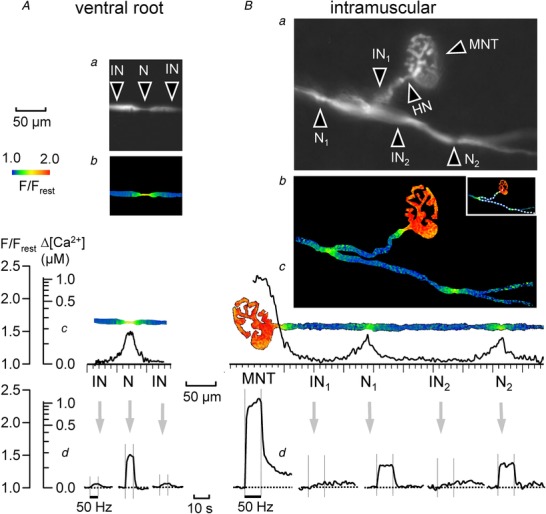
Figure 4. Stimulation‐induced elevations of nodal [Ca2+] in a ventral root axon (A) and in a motor axon coursing through the levator auris muscle (B) .

Both A and B show fluorescence images of an OG‐1‐filled axon (a), an elevation of nodal [Ca2+] during stimulation at 50 Hz, coded as F/F rest (b), the spatial extent of the Δ[Ca2+] response (c), and the time course of the response at nodal and flanking internodal regions (d). The intramuscular axon had 2 nodes, each at a branch point, and a heminode (HN) at the junction between the myelinated axon and the motor nerve terminal (MNT). Bb–d, also shows the much larger, prolonged [Ca2+] elevation averaged over the motor nerve terminal. For analysis the intramuscular axon (dotted lines in Bb inset) was digitally straightened to yield the image shown in Bc, as described in Methods. The spatial distributions in Ab and c and Bb and c were taken at the 5th and 10th second after beginning of stimulation at 50 Hz, respectively.
