
Figure 2. Compartmental analysis of synaptic NO signal transduction .
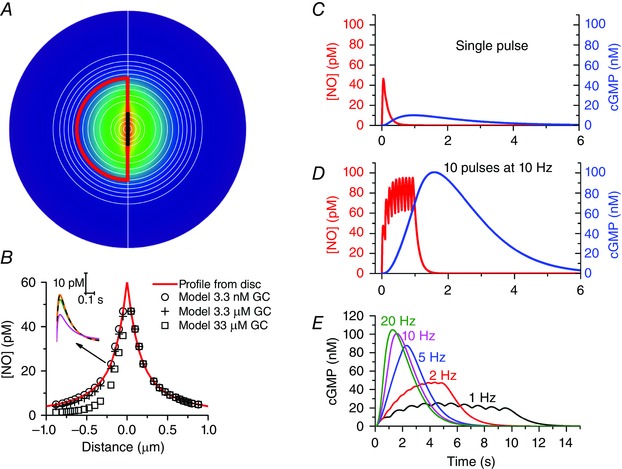
In the model A, which is an extension of one described previously (Wood et al. 2011), the synaptic space is divided into multiple concentric hemispheres, a group of which (outlined in red; radius = 0.6 μm) are designated the NO target structure. NO is generated in a 0.4 μm diameter zone (thick black line) at the base of the target structure and the colour‐coded NO profile from Fig. 1 B is shown centred on this zone. Distances correspond to the x‐axis in B. The target contains NO‐activated guanylyl cyclase (usually 3.3 μm) and cGMP‐stimulated phosphodiesterase‐5 having a maximal activity of 106 μm s−1 and a basal activity of 0.2% of this value. The kinetic schemes describing both these components were as published (Batchelor et al. 2010; Wood et al. 2011). NO is produced as a pulse having the shape depicted in the inset in B and peaking at a rate of 40 molecules s−1, with half the NO flowing each side of the emission zone through all available surfaces. The fluxes of NO in each hemisphere and of cGMP within the target hemispheres are calculated similarly to the method adopted for Ca2+ (Nowycky & Pinter, 1993; McHugh & Kenyon, 2004). The diffusion coefficients for NO and cGMP were those used previously (Wood et al. 2011) and NO was subject to first‐order decay (rate constant = 150 s−1) in each compartment. In B, the peak NO concentration in each hemisphere is plotted as a function of the concentration of NO‐activated guanylyl cyclase (GC) together with the concentrations obtained by solving analytically the equation for diffusion from a disc surface (Carslaw & Jaeger, 1986, eqn (10.3.10), p. 260) modified to include first‐order decay. The inset shows sample NO concentration profiles within the target structure, 0.2 μm from the emitting zone (orange line: profile from disc; dashed black line, green line and magenta line: profiles from model assuming NO‐activated guanylyl cyclase concentrations of 3.3 nm, 3.3 μm and 33 μm, respectively. The cGMP responses (blue lines; right‐hand ordinates) to either a single NO pulse (C) or to repeated pulses at 10 Hz (D) illustrate the likely activity dependence of NO‐mediated synaptic transmission effected largely by temporal summation at the level of guanylyl cyclase/cGMP. The sample NO traces (red lines; left‐hand ordinates) are from the central hemisphere. E shows the time‐courses of cGMP accumulation in response to 10 NO pulses delivered at different frequencies.