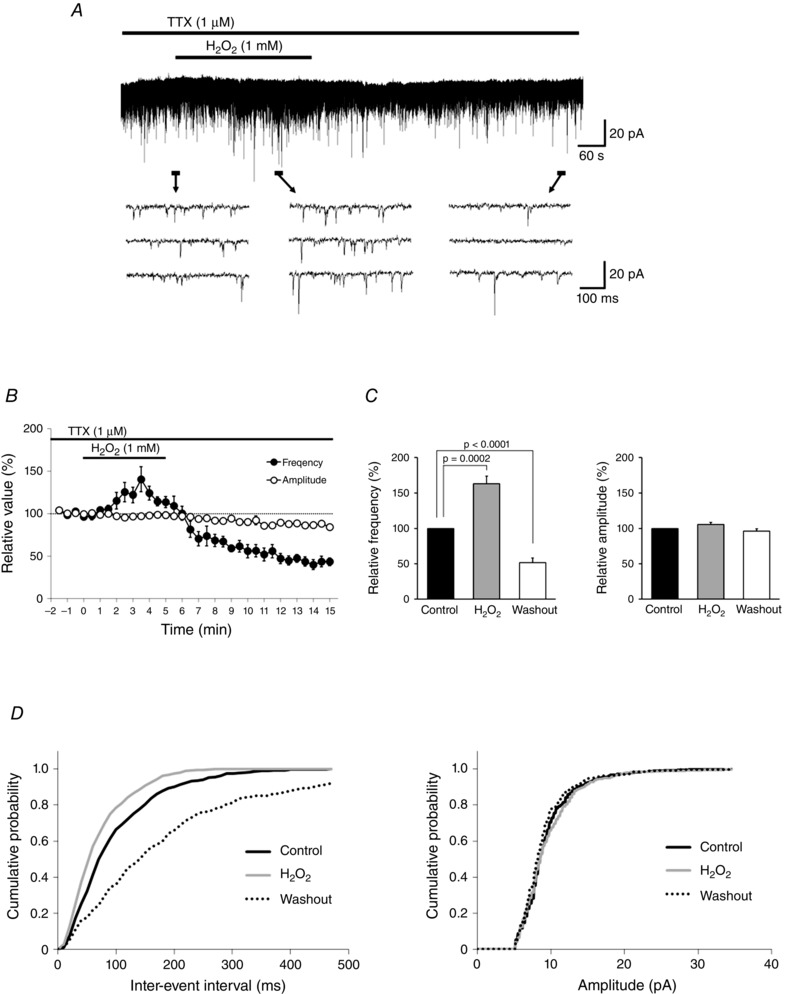
Figure 1. H2O2 induces an increase followed by depression in mEPSC frequency without affecting amplitude .

A, continuous chart recording of mEPSCs before, during and after H2O2 (1 mm) superfusion. B, average frequency (filled circles) and amplitude (open circles) of mEPSCs in the presence of H2O2 relative to the control, shown as a function of time (mean ± SEM, n = 11). C, summary of mEPSC frequency (left) and amplitude (right). Values are shown as percentage change in maximal values relative to the control during H2O2 superfusion and after washout (mean ± SEM, n = 11 each). P values were determined by a paired t test. D, cumulative distributions of the mEPSC inter‐event interval (left) and amplitude (right) before (continuous black line), during (grey line), and after (dotted line) H2O2 superfusion. Values were compared to the control with the Kolmogorov–Smirnov test. H2O2 had no effect on amplitude (during H2O2 superfusion: P = 0.13; after washout: P = 0.78), but inter‐event interval was shorter during H2O2 superfusion (P < 0.0001) and longer after washout (P < 0.0001). A and D were obtained from the same neuron. The holding potential was −70 mV for all recordings. Washout indicates the 10 min period after initiating H2O2 washout.
