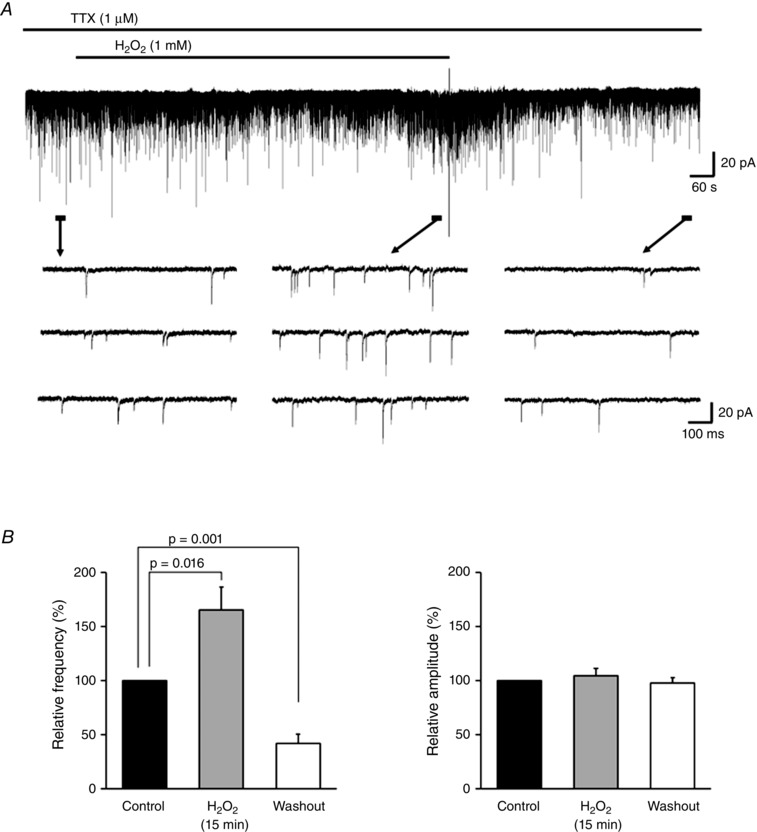
Figure 2. Prolonged application of H2O2 results in an increase followed by depression in mEPSC frequency .

A, continuous chart recording of mEPSCs before, during and after H2O2 (1 mm, 15 min) superfusion. B, summary of mEPSC frequency data. Values are shown as percentage change relative to the control after 15 min of H2O2 superfusion (n = 7) and after washout (n = 6) (mean ± SEM). P values were determined by a paired t test. The holding potential was −70 mV for all recordings. Washout indicates the 10 min period after initiating H2O2 washout.
