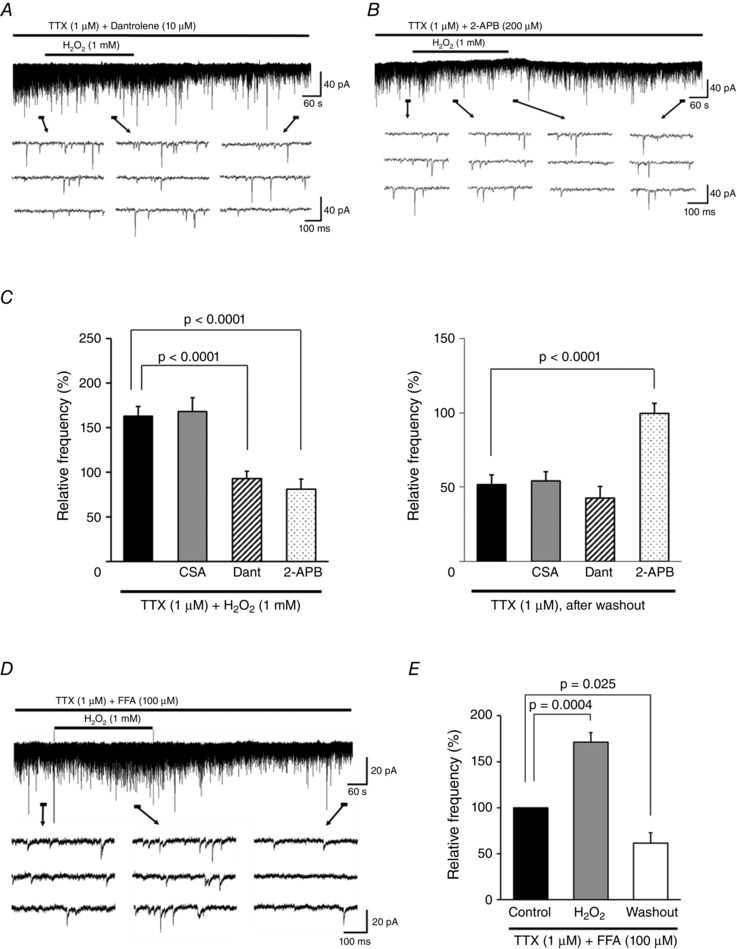
Figure 4. H2O2‐induced increases in mEPSC frequency are due to intracellular Ca2+ release via RyR and IP3R .

A, Dant (10 μm), an RyR antagonist, completely blocked the H2O2‐induced increase in mEPSC frequency but not the subsequent depression. B, the IP3R antagonist 2‐APB (200 μm) completely blocked both the increase and depression in frequency. Note that the increase not only was blocked but was reduced with respect to the control after 5 min of H2O2 superfusion (38.9 ± 3.2% of control, n = 6). C, summary of mEPSC frequency during (left) and after (right) H2O2 superfusion with TTX alone (n = 11) or with CSA (a MPT blocker/calcineurin inhibitor, 10 μm; n = 6), Dant (10 μm; n = 5–8), or 2‐APB (200 μm; n = 6) relative to the control (mean ± SEM). Values on the left indicate maximal values of mEPSC frequency relative to the control 1.5–6 min after H2O2 superfusion. P values were determined by one‐way ANOVA with a Bonferroni post hoc test. D, FFA (100 μm), a TRPM2 channel blocker, did not block the H2O2‐induced increase and subsequent depression in mEPSC frequency. E, summary of mEPSC frequency recordings in the presence of FFA (mean ± SEM, n = 7). Values in the charts correspond to percentage change in maximal values of mEPSC frequency relative to the control during H2O2 superfusion and after washout. The P value was determined by a paired t test. The holding potential was −70 mV for all recordings. Washout indicates the 10 min period after initiating H2O2 washout.
