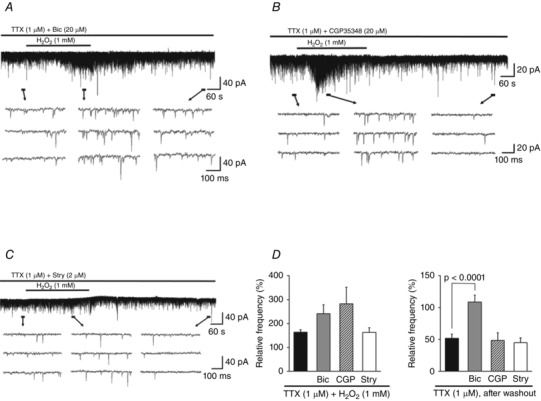
Figure 5. Effects of GABA and glycine receptor antagonists on H2O2‐induced changes in mEPSC frequency .

A, Bic (20 μm), a GABAA receptor antagonist, enhanced H2O2‐induced increases in mEPSC frequency and blocked its subsequent depression. B, CGP35348 (20 μm), a GABAB receptor antagonist, enhanced the increase in frequency but had no effect on the depression. C, Stry (2 μm), a glycine receptor antagonist, had no effect on H2O2‐induced changes in mEPSC frequency. D, summary of mEPSC frequency data during (left) and after (right) H2O2 superfusion with TTX alone (n = 11) or with Bic (20 μm; n = 7), CGP35348 (CGP, 20 μm; n = 6), or Stry (2 μm; n = 6) relative to the control (mean ± SEM). Values on the left indicate maximal values of mEPSC frequency relative to the control 1.5–6 min after H2O2 superfusion. P values were determined by one‐way ANOVA with a Bonferroni post hoc test. The holding potential was −70 mV for all recordings. Washout indicates the 10 min period after initiating H2O2 washout.
