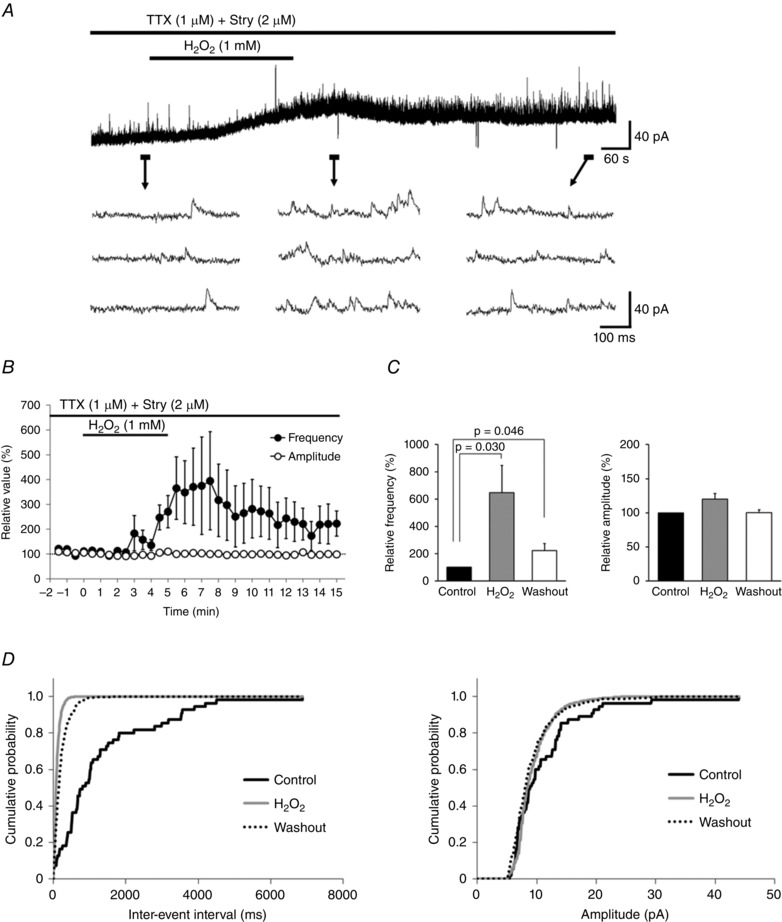
Figure 6. H2O2 increases the frequency of GABAergic mIPSCs .

A, continuous chart recording of GABAergic mIPSCs before during, and after H2O2 superfusion. H2O2‐induced increases in GABAergic mIPSC frequency were often accompanied by an outward current. B, average frequency (filled circles) and amplitude (open circles) of GABAergic mIPSCs after H2O2 superfusion relative to the control as a function of time (mean ± SEM, n = 8). C, summary of GABAergic mIPSC frequency (left) and amplitude (right) relative to the control (mean ± SEM, n = 8 each) showing an increase in frequency but not amplitude induced by H2O2. Middle columns of charts indicate maximal values of GABAergic mIPSC frequency and amplitude relative to the control following H2O2 superfusion. P values were determined by a paired t test. D, cumulative distributions of inter‐event interval (left) and amplitude (right) of GABAergic mIPSCs before (continuous black line), during (grey line), and after (dotted line) H2O2 superfusion. H2O2 did not significantly affect the distribution of amplitude (during H2O2 superfusion: P = 0.051; after washout: P = 0.061; Kolmogorov–Smirnov test) relative to the control, but shortened the inter‐event interval during H2O2 superfusion and increased the interval after washout (P < 0.0001 for each). A and D were obtained from the same neuron. The holding potential was 0 mV for all recordings. Washout indicates the 10 min period after initiating H2O2 washout.
