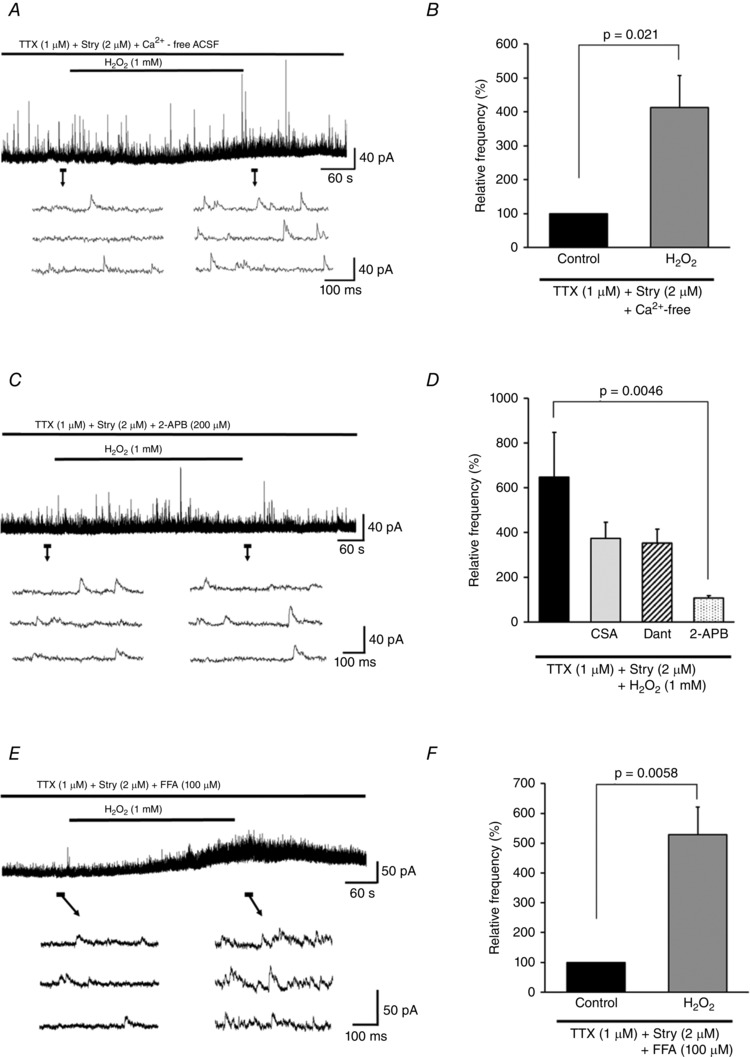
Figure 7. H2O2‐induced increase in GABAergic mIPSC frequency is due to intracellular Ca2+ release via IP3R .

A, H2O2‐induced increase in GABAergic mIPSC frequency was unaffected by Ca2+‐free ACSF. B, summary of GABAergic mIPSC frequency relative to the control in Ca2+‐free ACSF (mean ± SEM, n = 6). Values in charts correspond to percentage change in maximal values of GABAergic mIPSC frequency relative to the control following H2O2 superfusion. P values were determined by a paired t test. C, H2O2‐induced increase in GABAergic mIPSC frequency and outward current were completely blocked by 2‐APB (200 μm). D, summary of GABAergic mIPSC frequencies observed during H2O2 superfusion with TTX combined with either Stry (2 μm; n = 8), CSA (10 μm; n = 6), Dant (10 μm; n = 6), or 2‐APB (200 μm; n = 7) relative to the control (mean ± SEM). Maximal values of GABAergic mIPSC frequency relative to the control following H2O2 superfusion are shown. P values were determined by one‐way ANOVA with a Bonferroni post hoc test. E, FFA (100 μm) did not block the H2O2‐induced increase of GABAergic mIPSC frequency. F, summary of GABAergic mIPSC frequency data during FFA treatment (mean ± SEM, n = 6). Values in the charts correspond to the percentage change in maximal values of GABAergic mIPSC frequency relative to the control following H2O2 superfusion. The P value was determined by a paired t test. The holding potential was 0 mV for all recordings. Washout indicates the 10 min period after initiating H2O2 washout.
