
Figure 4. Myofibrillar protein content decreased after 3 weeks of muscle disuse and partially recovered after exercise .
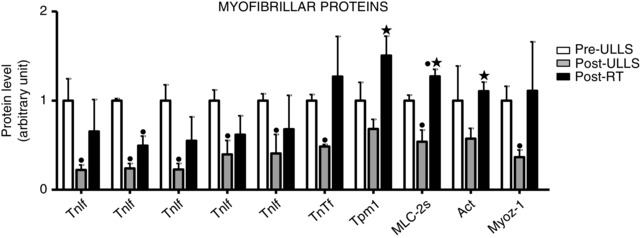
Histogram representing the volume of 2DE spots of differentially expressed myofibrillar proteins in Pre‐ULLS, Post‐ULLS and Post‐RT groups. • P < 0.05, significantly different from Pre‐ULLS; *P < 0.05, significantly different from Post‐ULLS. Data are themean ± SEM. Full information on the proteins and the numerical ratios between volumes is provided in Table 1.