
Figure 7. Validation of anti‐oxidant and metabolic protein expression changes by western blot analysis .
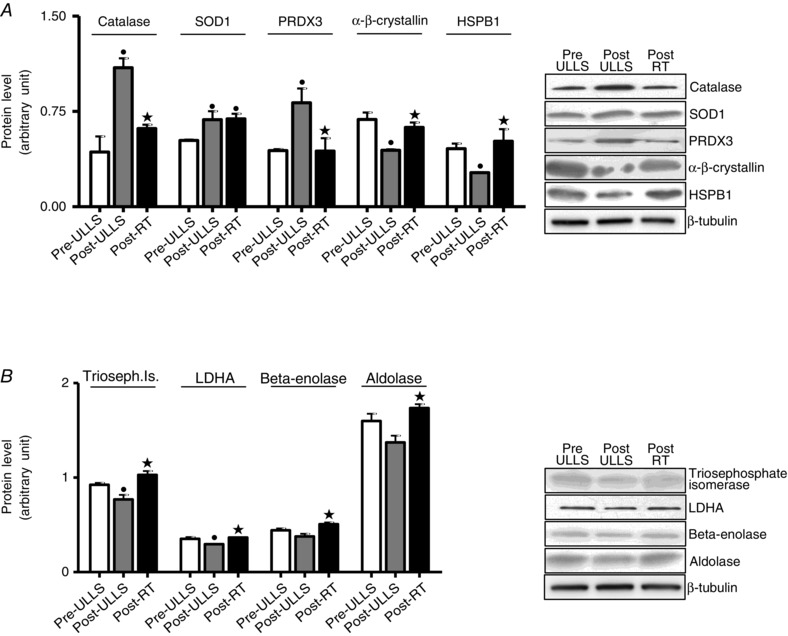
Quantification of protein levels by western blot analysis of (A) catalase, SOD1, PRDX3, α‐β‐crystallin and HSPB1 and (B) triosephosphate isomerase, lactate dehydrogenase, β‐enolase and aldolase in Pre‐ULLS, Post‐ULLS and Post‐RT groups. • P < 0.05, significantly different from Pre‐ULLS; *P < 0.05, significantly different from Post‐ULLS. Data are themean ± SEM.