
Figure 1. Comparison of simulated (lines) and experimental (points) time course of PCr (percentage of resting values), pH (A) and ATP supply flux (B) during severe intensity rest‐to‐exercise‐to‐recovery transitions with moderate glycolytic inhibition by protons (Simulation 1) .
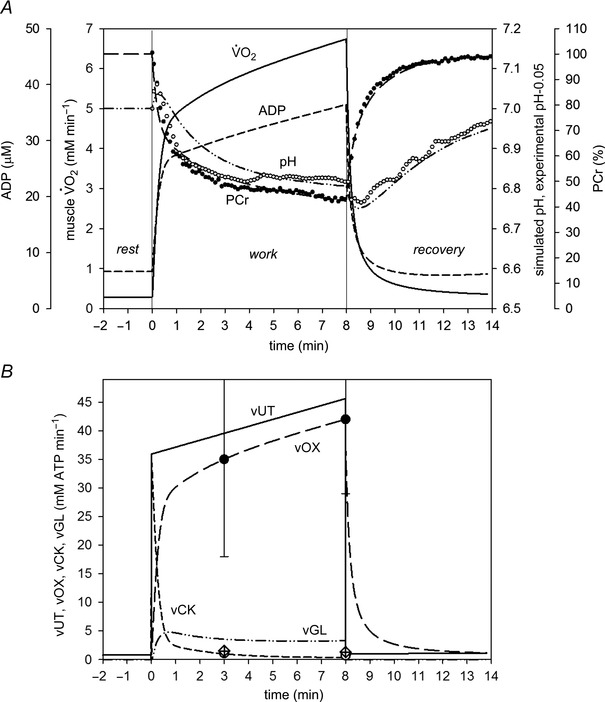
Time course of simulated muscle and ADP is also shown. Experimental points for bilateral KE exercise in humans were taken from Cannon et al. (2014). Vertical lines indicate the onset and cessation of exercise. vOX, ATP supply rate by OXPHOS; vCK, ATP supply rate by CK; vGL, ATP supply rate by anaerobic glycolysis; vUT, muscle ATP utilization (ATP hydrolysis). 0.05 was subtracted from experimental pH values to scale experimental pH at rest to the value of 7.0, used in computer simulations.