
Figure 7. KCNE4 expression increases Kv7.4 membrane abundance in HEK cells .
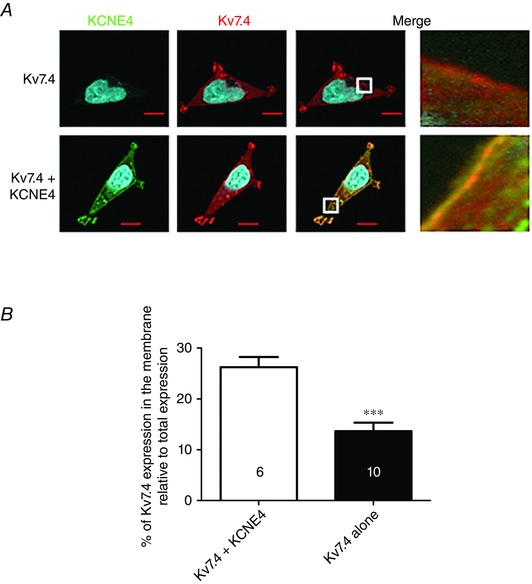
A, representative HEK cells expressing Kv7.4 (red) alone or Kv7.4 with KCNE4 (green). The white boxes in the merged panel are expanded to the right to show membrane fluorescence. B, quantification of Kv7.4 membrane‐like expression as a percentage of the total Kv7.4 expression. Data are the mean ± SEM. The number of cells analysed is indicated in each bar as taken from three separate experiments. ***P < 0.001, according to a Mann–Whitney test.