Figure 1.
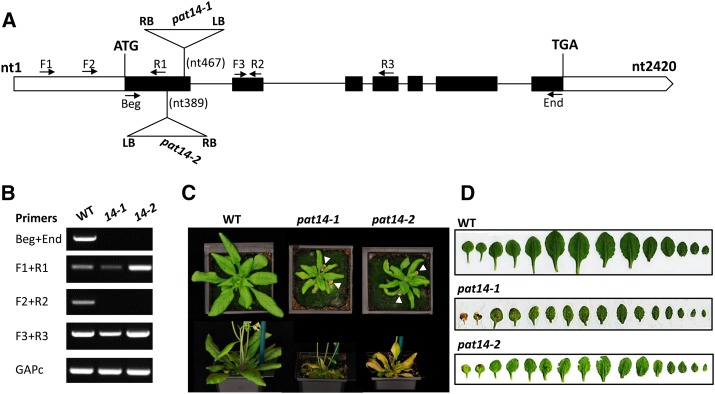
Molecular characterization of the atpat14-1 (SALK_026159) and atpat14-2 (GK-153A10) alleles. A, Schematic presentation of the AtPAT14 gene (solid boxes, exons; empty boxes, untranslated regions; lines, introns) and the positions of the T-DNA in atpat14-1 and atpat14-2. Arrows, Primers used for RT-PCR; RB, right border; LB, left border. B, Amplification of different regions of the AtPAT14 transcript in wild-type, atpat14-1, and atpat14-2 plants using primers according to A. The GAPc transcript served as a control. C, Four- (top) and 6-week-old (bottom) plants of wild-type Columbia-0, atpat14-1, and atpat14-2. White arrowheads highlight leaf senescence in mutants. D, Leaf line-ups of 5-week-old wild-type Columbia-0, atpat14-1, and atpat14-2 plants.

