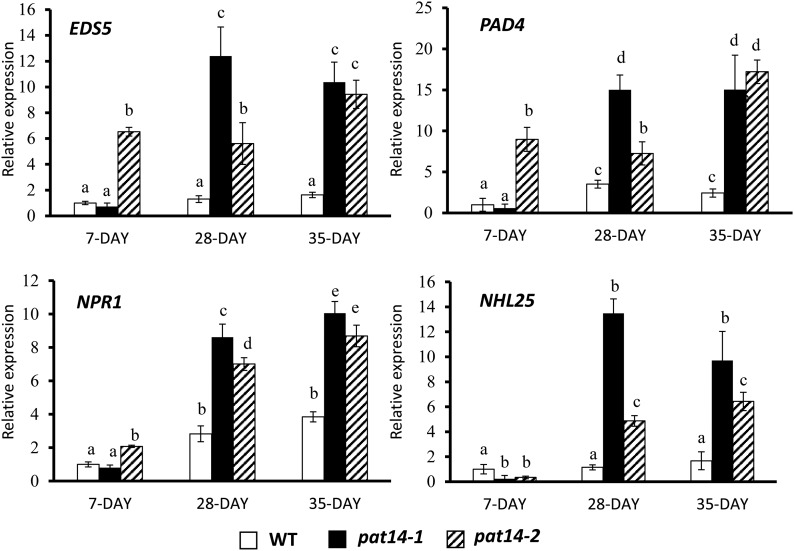
Figure 8.
Transcript levels of SA signaling genes monitored by real-time PCR. The gene expression level in the 7-d-old wild-type (WT) seedlings is regarded as 1, and their relative expression levels in 28-d-old leaves were calculated. The experiments were repeated three times. Each bar represents the mean ± SE (n = 3). Different letters above the columns indicate statistically different values analyzed by one-way ANOVA.

