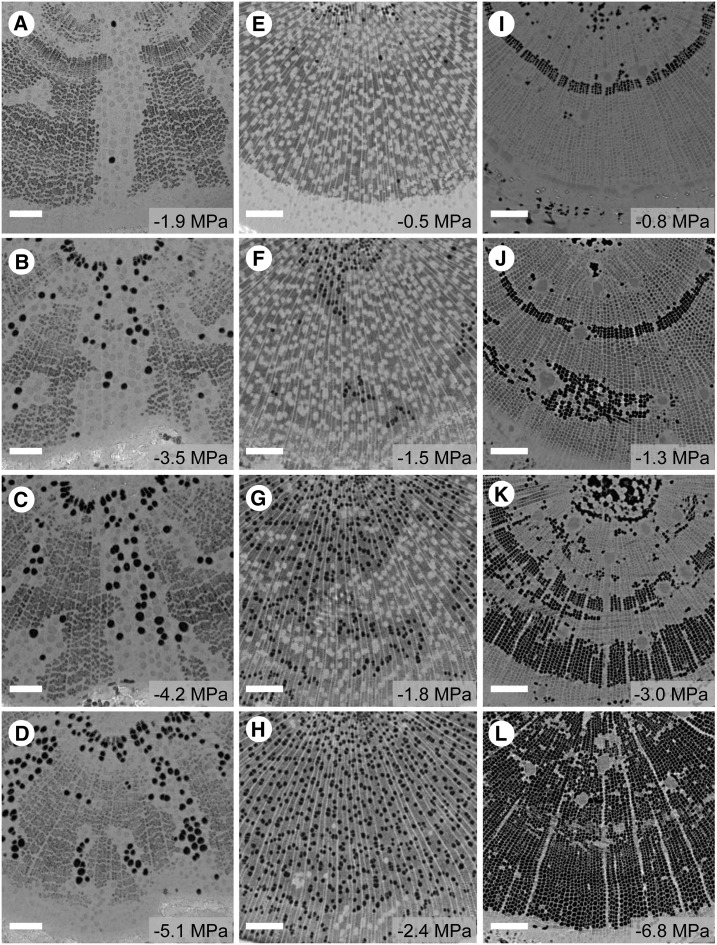
Figure 4.
Visualization by microCT showing the progressive spread of embolism in the xylem of three woody plant species during dehydration: Q. robur (A–D), P. tremula × P. alba (E–H), and P. pinaster (I–L). Embolized conduits appear as black space in the cross section, while water-filled conduits appear as light gray. Each column shows transverse slices through the main stem axis with increasing water stress down the column. The bagged leaf water potential of each sample at the time of scanning is given at bottom right. Bars = 200 μm.

