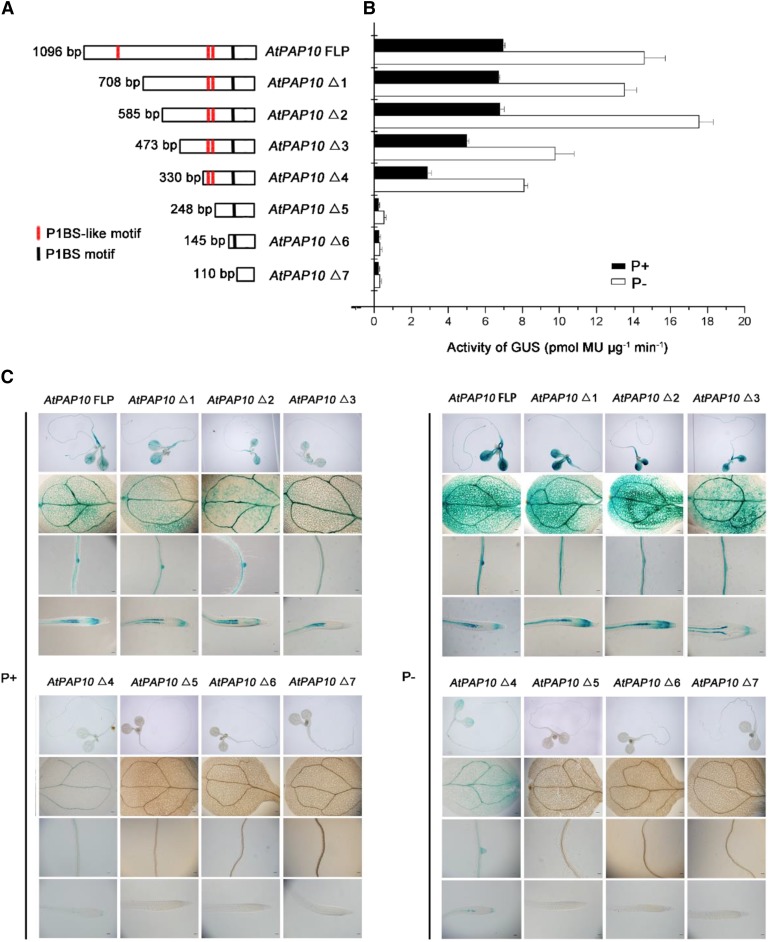
Figure 2.
Deletion analysis of the AtPAP10 promoter. A, A diagram showing eight deletion constructs of the AtPAP10 promoter. The length of the promoter (from its 5′ end to the start codon) for each construct is indicated on the left, and the name of the construct is indicated on the right. The location of the P1BS element and P1BS-like elements is indicated by a black line and red lines, respectively. B, GUS activity of a representative line for each AtPAP10:GUS construct. Values are means ± se of three biological replicates. C, Expression patterns of eight AtPAP10:GUS constructs in 8-d-old seedlings grown under P+ and P− conditions. The names of the constructs are indicated at the top. For each construct, the GUS expression patterns in whole seedling, cotyledon, root maturation zone, and root tip are shown (from top to bottom). Bars = 20 μm.

