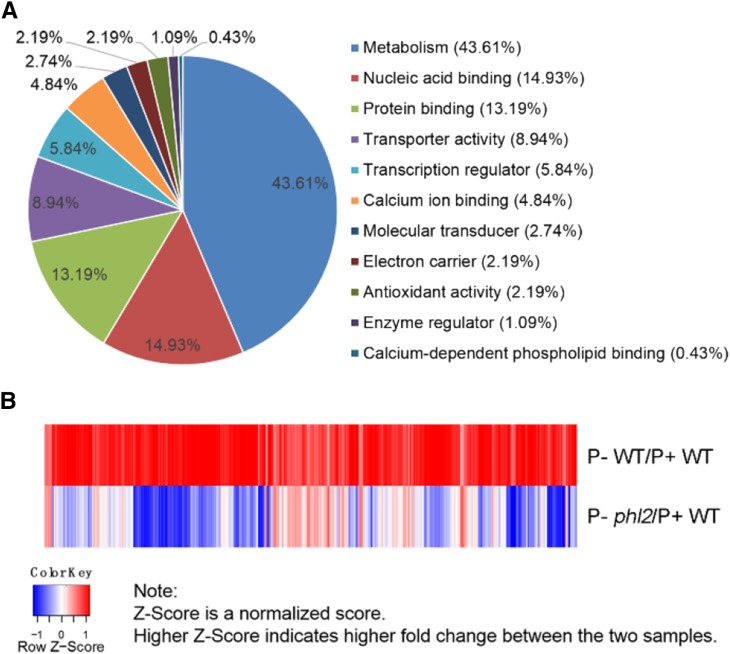
Figure 9.
RNA-seq analysis of PSI genes in the wild type and phl2. A, GO analysis of 581 PSI genes. B, A heat map of the RNA-seq analysis showing the differentially expressed PSI genes in the wild type and phl2. The map shows the expression of 581 upregulated genes in the wild type with a cut-off value = 2-fold (FDR < 0.05) and expression levels of the corresponding genes in phl2. The formula for calculating the z-score was z = (x − μ)/σ, where x is the fold-change value, μ is the mean, and σ is the sd.

