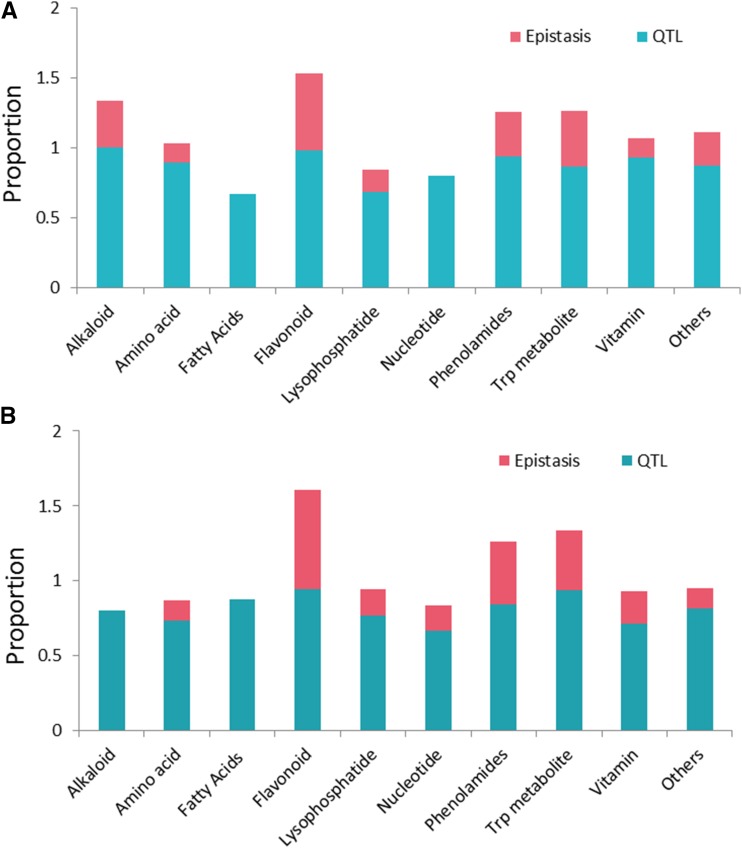
Figure 3.
Schematic representation of QTL identification for metabolic traits measured in BB (A) and ZY (B) RIL populations across different environments. The blue bars represent the proportion of metabolic traits that have at least one QTL identified; the red bars represent the proportion of metabolic traits for which epistatic effects were identified.

