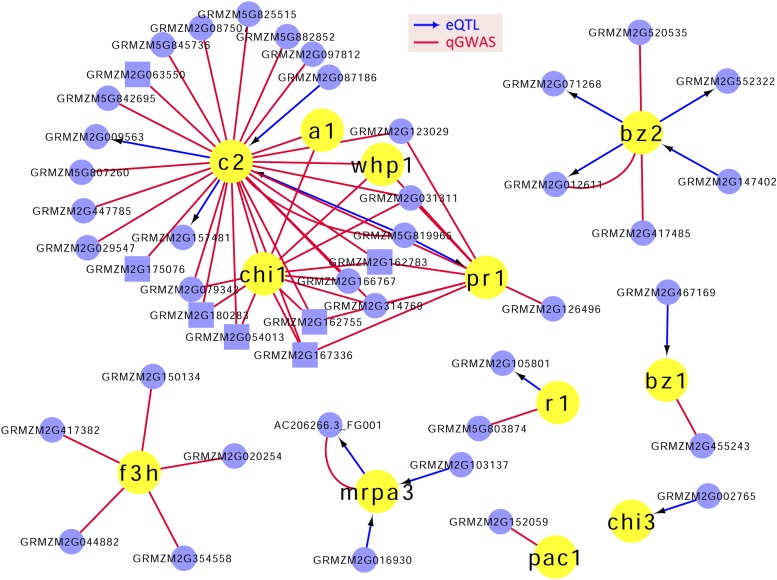
Figure 4.
Primary regulatory network of genes associated with the flavonoid biosynthetic pathway. Yellow circles represent the 12 genes of known function associated with flavonoids. Blue nodes represent newly identified genes, including genes involved in flavonoid biosynthesis (squares) based on functional annotation. Relationships between genes are indicated by blue arrows (revealed by eQTL analysis) or red lines (revealed by qGWAS).

