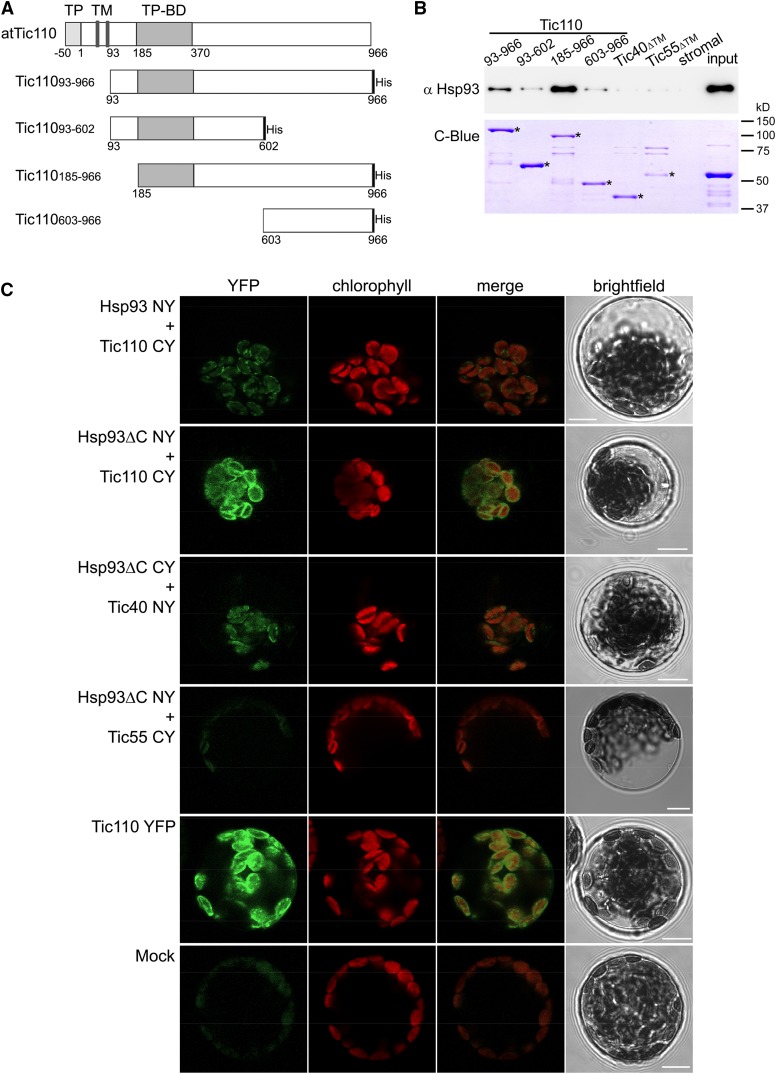
Figure 1.
Interaction of Hsp93 with the envelope protein Tic110. A, The depicted Tic110 domains were generated for in vitro interaction studies. TP, Transit peptide; TM, transmembrane domain; TP-BD, TP binding domain. The respective recombinant proteins, carrying a His-tag at the C terminus, were expressed in a bacterial system and purified, as were recombinant Tic40 and Tic55 (with no TM, ΔTM) control proteins. B, In vitro pull-down analysis to evaluate the interaction of Hsp93 with the Tic110, Tic40, and Tic55 recombinant proteins. Equimolar amounts (175 pmol) of immobilized His-tagged recombinant proteins were incubated (3 h at 4°C) with a stromal protein fraction (input) from isolated wild-type chloroplasts (approximately 200 μg). A control assay (stromal) conducted in the absence of His-tagged protein enabled evaluation of potential unspecific affinity between the stromal proteins and the Ni-NTA beads. The figure shows immunoblot analysis of 30% of the eluted proteins using an antibody against Hsp93. A fraction (20%) of the pulled-down protein was also analyzed by SDS-PAGE and Coomassie Brilliant Blue staining (C-Blue) to visualize the recombinant proteins; asterisks indicate the correct band for each recombinant protein. A sample (approximately 2 μg) of the stromal fraction input was similarly analyzed. C, In vivo analysis of the protein interactions by BiFC. Wild-type protoplasts were (co)transfected with the indicated constructs and analyzed by confocal microscopy for YFP fluorescence and chlorophyll autofluorescence (merged images of these two are also presented), and by bright-field illumination. Interaction of Tic110 or Tic40 with Hsp93 or with Hsp93ΔC was indicated by the reconstitution of YFP fluorescence, as can be seen in the representative images shown. No YFP signal was detected in assays for a potential Hsp93-Tic55 interaction (this served as a negative control). The Tic110 YFP panel illustrates a typical distribution of fluorescence at the envelope of the chloroplast. The Mock panel illustrates typical background levels of fluorescence seen in a nontransfected protoplast using imaging settings equivalent to those employed in the other panels. Bars = 10 μm.

