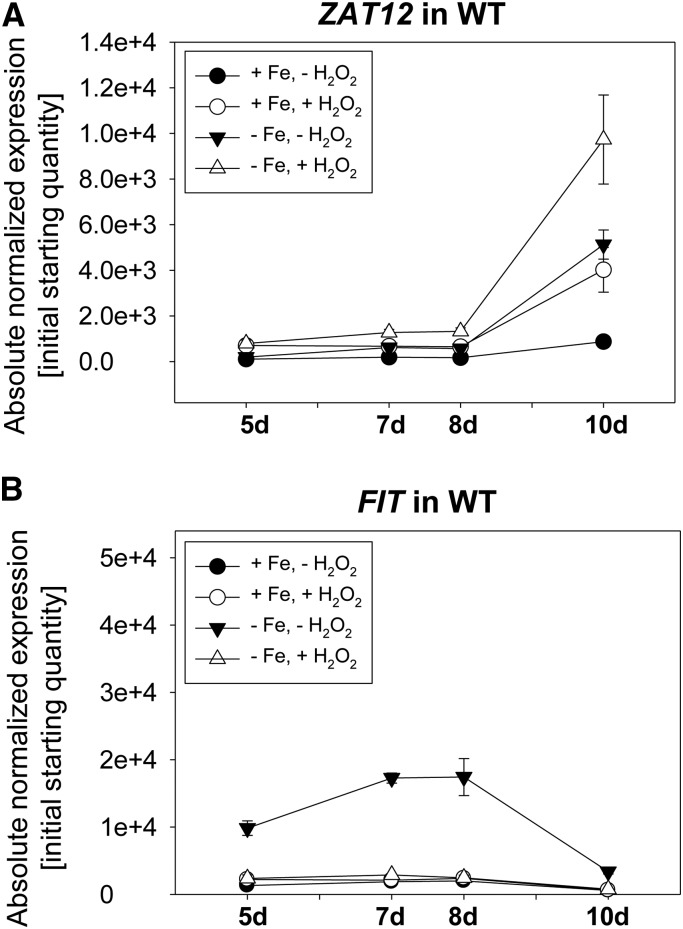
Figure 2.
Time-course gene expression analysis of ZAT12 and FIT in wild-type (WT) plants. Gene expression analysis of ZAT12 (A) and FIT (B) was performed on 5-, 7-, 8-, and 10-d-old seedlings grown on Fe-sufficient (+Fe) or Fe-deficient (−Fe) medium with 20 mm H2O2 or water control treatment for 1 h. Error bars represent sd of three biological replicates.

