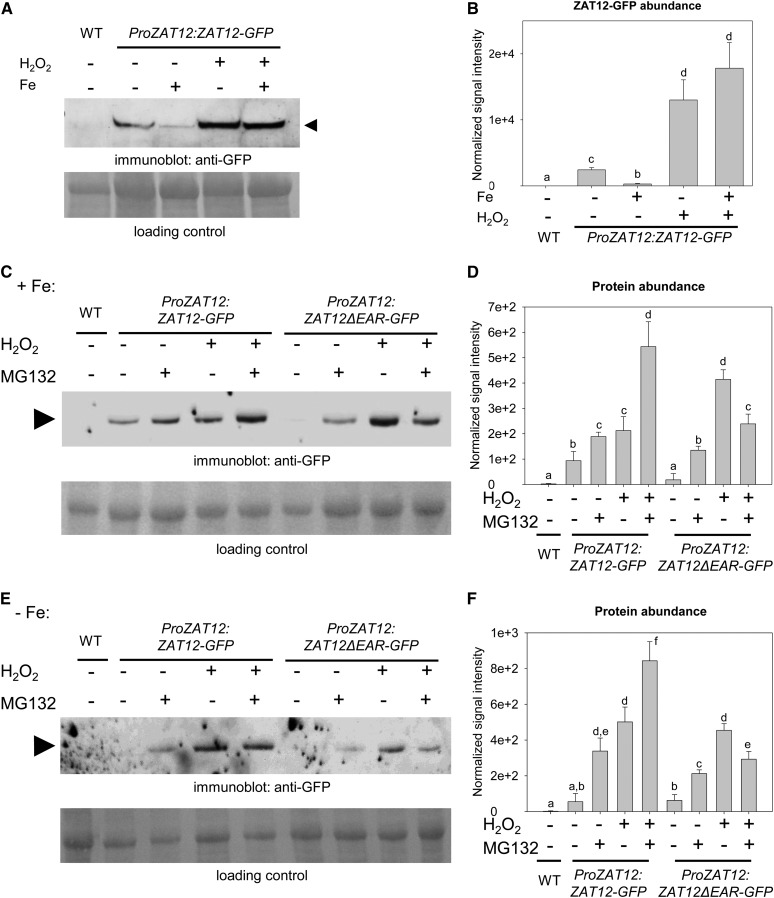
Figure 3.
ZAT12 protein abundance and regulation. A and B, Anti-GFP immunoblot analysis of ZAT12-GFP in 10-d-old ProZAT12:ZAT12-GFP seedlings grown on Fe-sufficient (+Fe) or Fe-deficient (−Fe) medium. For the H2O2 treatment, seedlings were incubated with 20 mm H2O2 (+) or water (−) for 1 h prior to harvesting for analysis. The arrowhead indicates the position of ZAT12-GFP (48 kD). Wild-type (WT) seedlings were used as a negative control. Ponceau S staining of the membrane was used as a loading control. C to F, Anti-GFP immunoblot analysis of ZAT12-GFP and ZAT12ΔEAR-GFP protein abundance in ProZAT12:ZAT12-GFP and ProZAT12:ZAT12ΔEAR-GFP seedlings grown for 10 d on sufficient (C and D) and deficient (E and F) Fe supply. For the H2O2 treatment, seedlings were incubated with 20 mm H2O2 (+) or water (−) for 1 h prior to harvesting for analysis. For the MG132 treatment, seedlings were incubated with 100 µm MG132 (+) or mock treated (−) for 4 h prior to harvesting for analysis. Arrowheads indicate the positions of the bands corresponding to ZAT12-GFP (48 kD) and ZAT12ΔEAR-GFP (47 kD). Wild-type seedlings were used as a negative control. Ponceau S staining of the membrane was used as a loading control. B, D, and F show quantification of A, C, and E, respectively, based on three independent experiments. Bars represent normalized protein abundance. Error bars represent sd. Different letters indicate statistically significant differences (P < 0.05).

