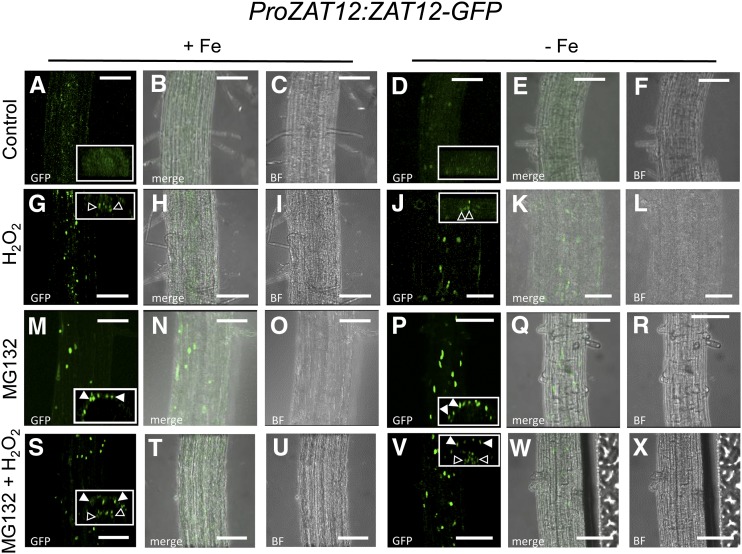
Figure 4.
Cellular ZAT12-GFP protein localization in the root. Confocal microscope images show the early differentiation zone of ProZAT12:ZAT12-GFP seedlings grown for 10 d under Fe-sufficient or Fe-deficient conditions, as indicated, and examined for ZAT12-GFP localization. For the H2O2 treatment, seedlings were incubated with 20 mm H2O2 for 1 h; for the MG132 treatment, seedlings were incubated with 100 µm MG132 for 4 h, prior to imaging. Mock-treated plants were used as a control. A, D, G, J, M, P, S, and V are GFP fluorescence images; C, F, I, L, O, R, U, and X are bright-field images (BF); B, E, H, K, N, Q, T, and W are merged GFP and bright-field images. Insets represent optical cross sections of the respective confocal images (for enlarged images, see Supplemental Fig. S3). Closed arrowheads show signal accumulation in the epidermis, and open arrowheads show signal accumulation in the central cylinder. Bars = 50 µm.

