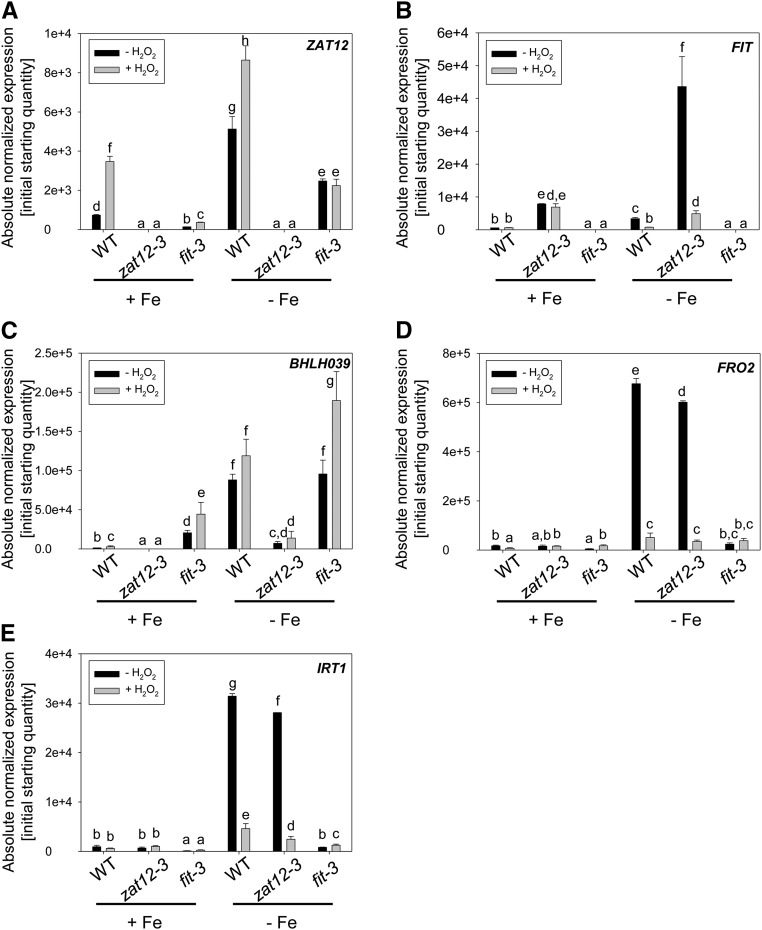
Figure 7.
Expression of Fe deficiency response genes. Gene expression analysis of ZAT12 (A), FIT (B), BHLH039 (C), FRO2 (D), and IRT1 (E) in wild-type (WT), zat12-3, and fit-3 seedlings is shown. Seedlings were grown for 10 d under sufficient (+Fe) or deficient (−Fe) Fe supply and then incubated with 20 mm H2O2 (+) or water (−) for 1 h prior to harvesting for analysis. Error bars represent sd. Different letters indicate statistically significant differences (P < 0.05).

