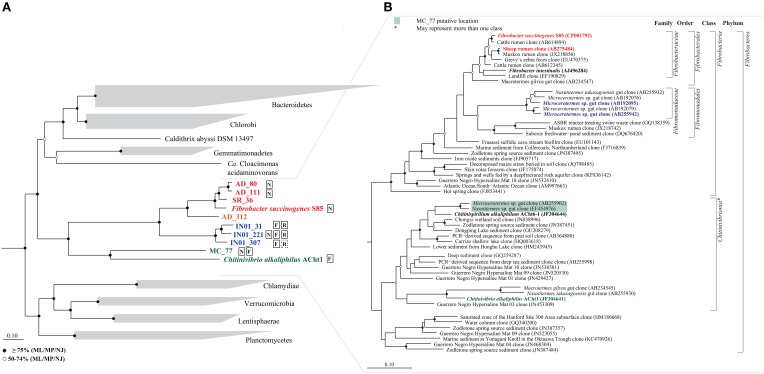
Figure 1.
Phylogenetic analysis of the phylum Fibrobacteres. (A) Maximum likelihood tree of the phylum Fibrobacteres based on alignment of 83 concatenated proteins as previously described (Soo et al., 2014). The tree was inferred using an outgroup comprising 2358 genomes from 33 phyla. For clarity, only the immediate phylum-level neighborhood of the Fibrobacteres is shown. Fibrobacteraceae genomes are shown in red; Fibromonadaceae in blue; and Chitinivibronia in green. Fibrobacteres genomes encoding nitrogen-fixing, flagellar and/or respiratory genes are indicated by N, F, and R in boxes (dotted box indicates incomplete genes), respectively. Bootstrap support for interior nodes using multiple inference methods is shown according to the legend at the lower left of the figure; ML, Maximum Likelihood; MP, Maximum Parsimony; NJ, Neighbor Joining. (B) Maximum likelihood tree based on 16S rRNA genes from Fibrobacteres and TG3 obtained from SILVA database release 119 (Quast et al., 2012). The closest matches to the partial 16S rRNA sequences obtained from the population genomes are indicated by color matching to (A), noting that the position of MC_77 is estimated since this genome lacks a 16S rRNA sequence. Isolates are bolded in black. Taxonomic group names by rank are proposed to the right of the tree, also see main text. Node support values are as described for (A).

